Compensation and unmixing are methods of estimating the total measured signal of each fluorochrome.
Theory
In a cytometric experiment, we measure signal emitted by various fluorochromes across a set of detectors within our cytometer. Estimating how much of the signal in each detector came from a specific fluorochrome, and then summing those values to produce an intensity measure per parameter is the process known as either compensation or unmixing.
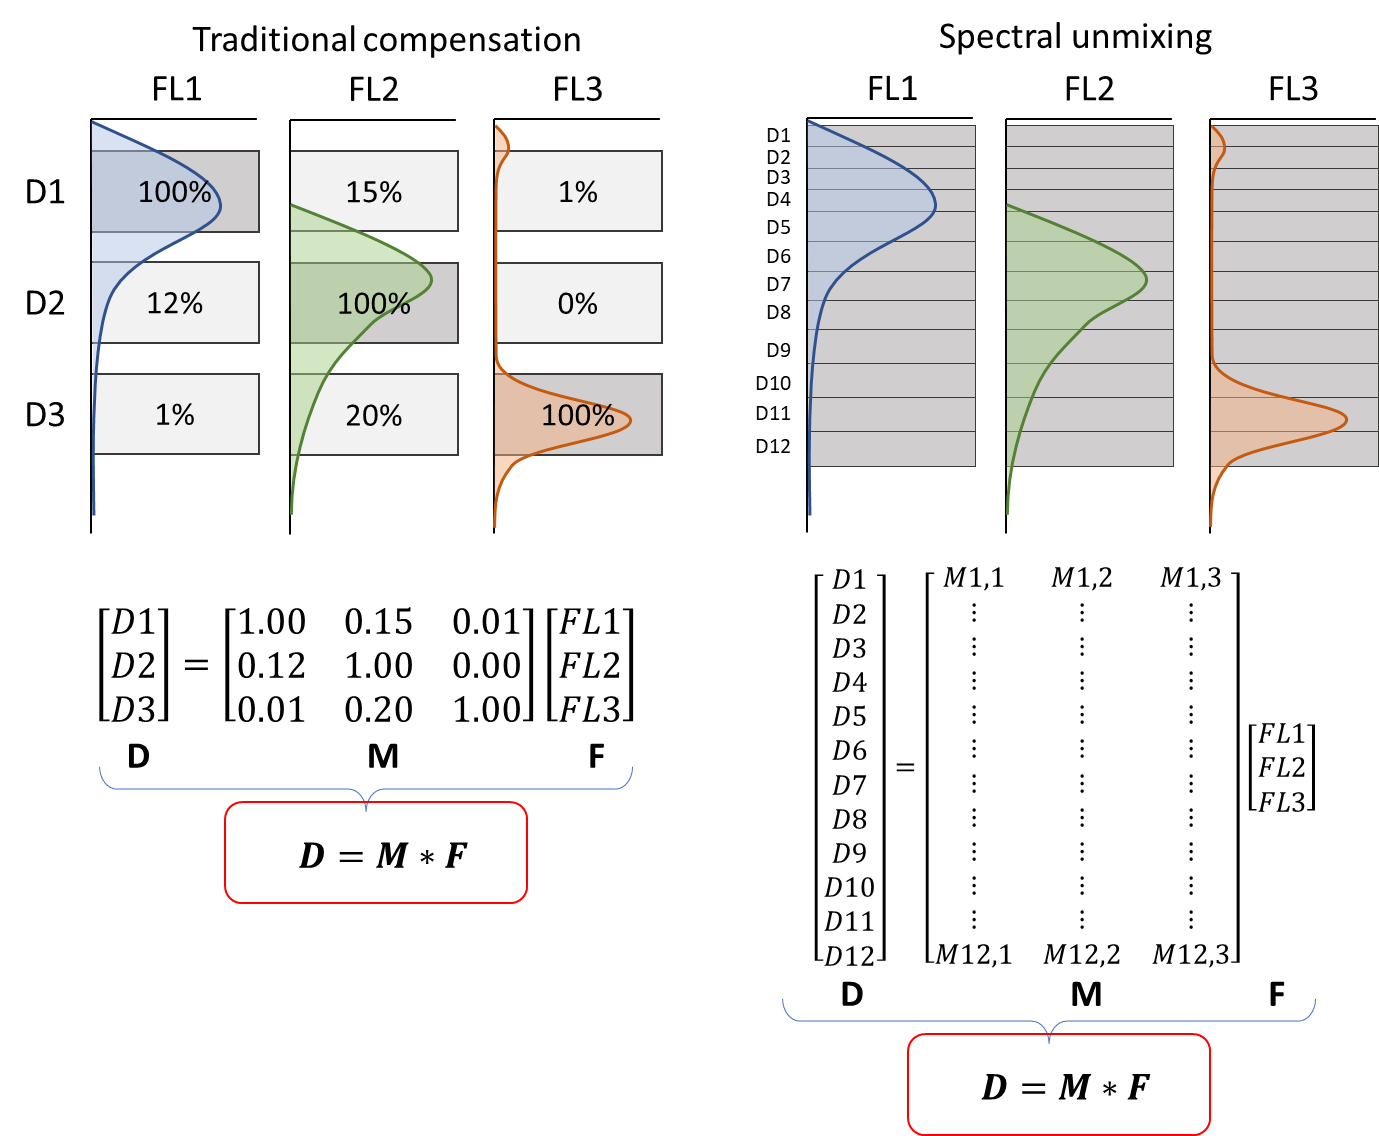
Unmixing is the general term for any number of detectors and fluorochromes. Compensation is a special case of unmixing in which the number of fluorochromes and detectors match, which allows for easier math. Figure 1 shows an illustration of the process for both cases, in which:
- D is the measurements obtained from the full set of detectors
- M is the spillover matrix
- F is the fluorescence emitted by the full set of fluorochromes

Figure 1 Illustration of a three color experiment on both a traditional and spectral system.
After running an experiment, we have the values of D, can calculate the values of M from single stain controls, and will use those values to estimate F. Solving those equations involves inverting the matrix M, which is easier for the square matrices that result from a matching number of fluorochromes and detectors, but doable either way. Figure 2 shows the outcome.

Figure 2 Solving for F
Single Stain Controls
Regardless of what other options you chose, the starting point of unmixing is collecting single stain controls that reflect the state of your assay at the time of acquiring your experimental data. Single stain controls are a set of tubes with only one fluorochrome added to each. These controls allow us to see the distribution of that fluorochrome's signal across all detectors with the clarity of knowing all of the signal is from that color, plus whatever contribution of background and electronic noise are present. Quality of the staining and noise can vary from day to day, even when running experiments on the same cytometer, so best practice is to collect single stain controls at the same time as the rest of the data.
The distribution of this data is represented as a ratio of signal compared to the brightest single detector, which is generally referred to as the primary detector. The set of of detector measurements for all single stain controls becomes your spillover matrix M.
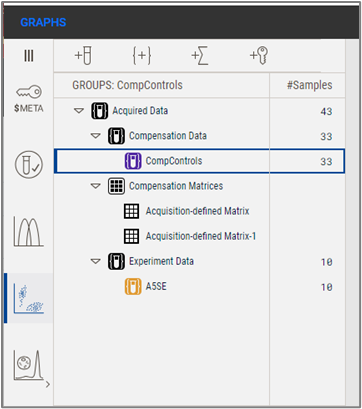
In Version 11, all data is stored in the Acquired Data group, and FlowJo will separate Compensation Data from Experiment Data as groups, using the criteria that the single stain controls will contain 'Comp' or 'Unstained' somewhere in the sample name.

Figure 3 Single stain controls in the hierarchy
Acquisition-defined versus Unmixing in FlowJo
The process of taking single stain controls and using them to solve for F can be done either on most cytometers or in FlowJo. Each has their advantage. Unmixing on a modern cytometer allows you to embed the spillover matrix in the .FCS files. Doing it in FlowJo is usually faster and offers some additional options. The process is very similar either way and should result in very similar outcomes so its really a matter of personal preference and optimizing your own workflow.
Unmixing in FlowJo
There are two primary paths to unmix in FlowJo, and we'll go through each on their own page:
- One-touch Unmixing
- The Unmixing Wizard
Additionally, there are two approaches to solving the matrix of equations for F. The default option in Version 11 is AutoSpill, whereas the more traditional approach is to use gates. For more information on AutoSpill, follow one of these links:
