
Kinetics models output a set of summary statistics for each time range.
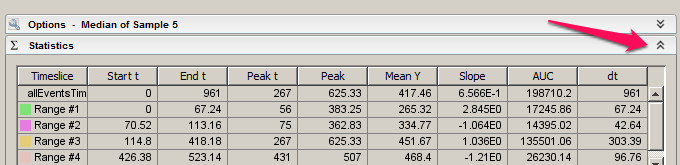
On each kinetics model the statistics disclosure arrow can be opened to reveal a set of summary statistics. Simply click the arrow on the right side of the model, as shown below, to view them.
The utility of the statistics will vary depending on the particular hypothesis being tested.
- Start t: The time in seconds that a time range begins. Double clicking on a particular range will open a dialogue box that allows users to type in the particular start and end times.
- Note: Time points depend on the measured collection times of the events. There may not have been an event collected at the exact second specified. In that case FlowJo will match the typed in time to the closest collected event.
- End t: The ending time in seconds of a time range.
- Peak t: The time that the maximum Y-axis value occurred at for the specific time range noted. Useful for determining the time for a reaction to reach its maximum or to determine the location of an inflection point.
- Peak: The magnitude of the Y-axis value at its maximum for the specific time range noted.
- Mean Y: The mean of the Y-axis value for the time time range noted.
- Slope: The gain or loss of intensity over the duration of the time range, for the calculated linear regression line of the data in this range. A positive slope implies that the Y-axis value was generally increasing over the time range, while a negative value implies that it was generally decreasing.
- AUC: Area under the curve. The area is calculated through numerical integration and is useful for describing both the magnitude and duration of a response in one number.
- dt: Delta time, or the change in time. End t – Start t.
See Also: