Customize the display of your Primary Plot in the Graph Properties Panel.
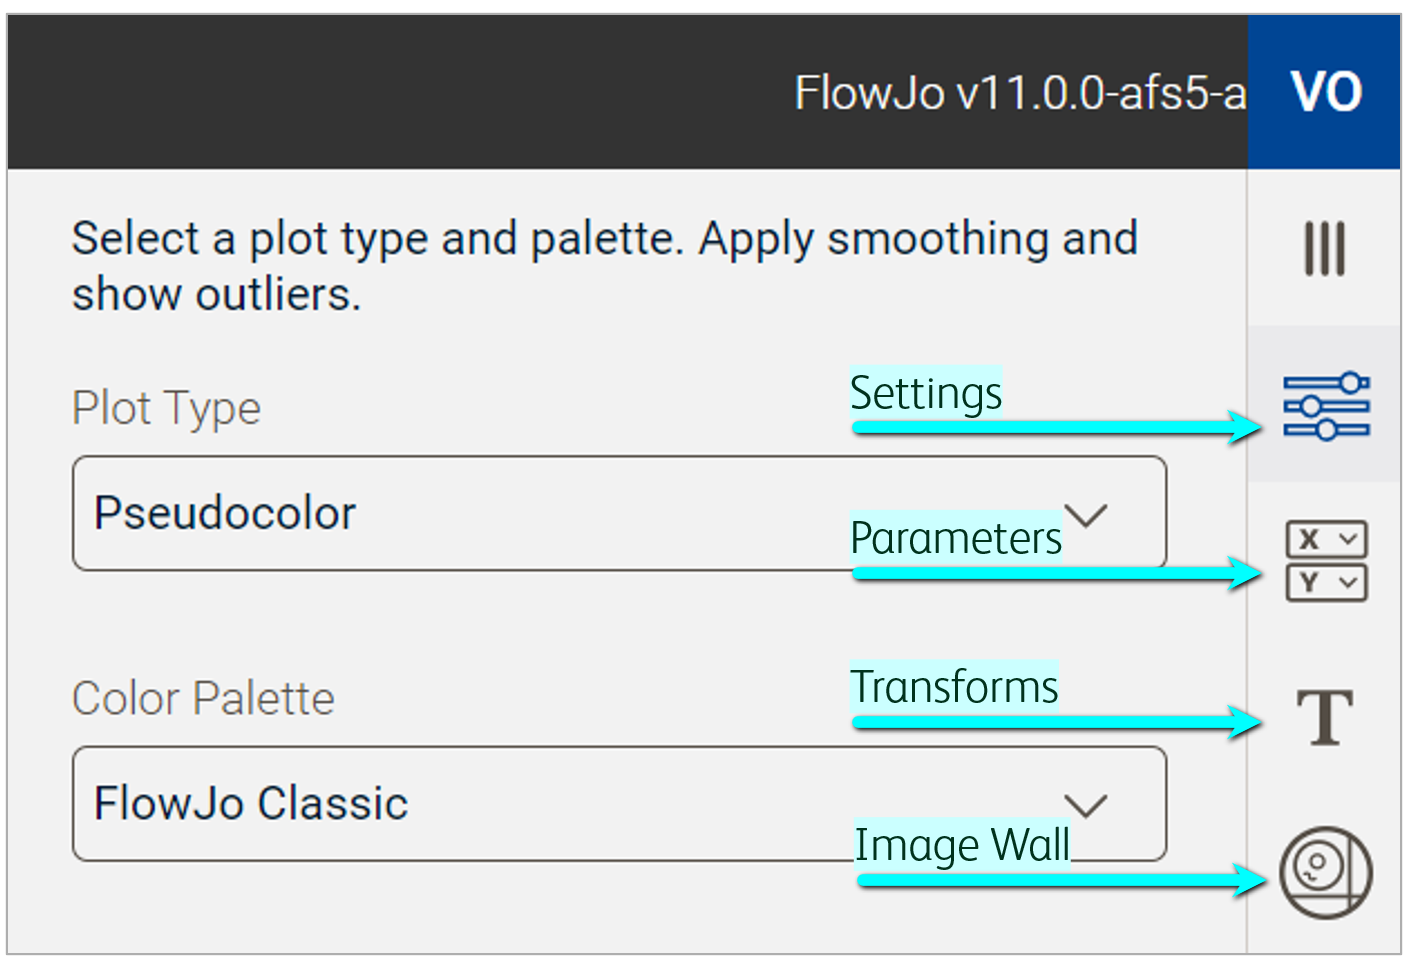
While going through your analysis or in preparing plots for presentations, you may need to adjust certain aspects of your graph or images, such as the plot type, color palette, or scaling. These aspects can be controlled using the various properties of the Graph Properties Panel (Figure 1).
Once you have data displayed in the Primary Plot of the Graphs Context, click a Property in the Navigation Bar to display controls for that graph’s properties. Click the collapse icon at the top of the Navigation Bar to hide or expand this panel.

Figure 1. Graph Properties Panel
Properties
Settings: Select a plot type (e.g. pseudocolor or contour), color palette, and set the thickness and color of gates.
Parameters: Select an axis and parameter to be displayed on the Primary Plot. Use default or custom parameter sets to quickly filter through parameters.
Transforms: Adjust the transformation and scaling of one or more parameters to visually expand or compress data on the Primary Plot.
Image Wall: Adjust channel settings to clarify image features. View images and plot the location of an event on the Primary Plot.
