Version 11 is now an immersive application in which controls on the left determine which context will be displayed in the dominant center portion of the program, and controls on the right allow for fine tuning.
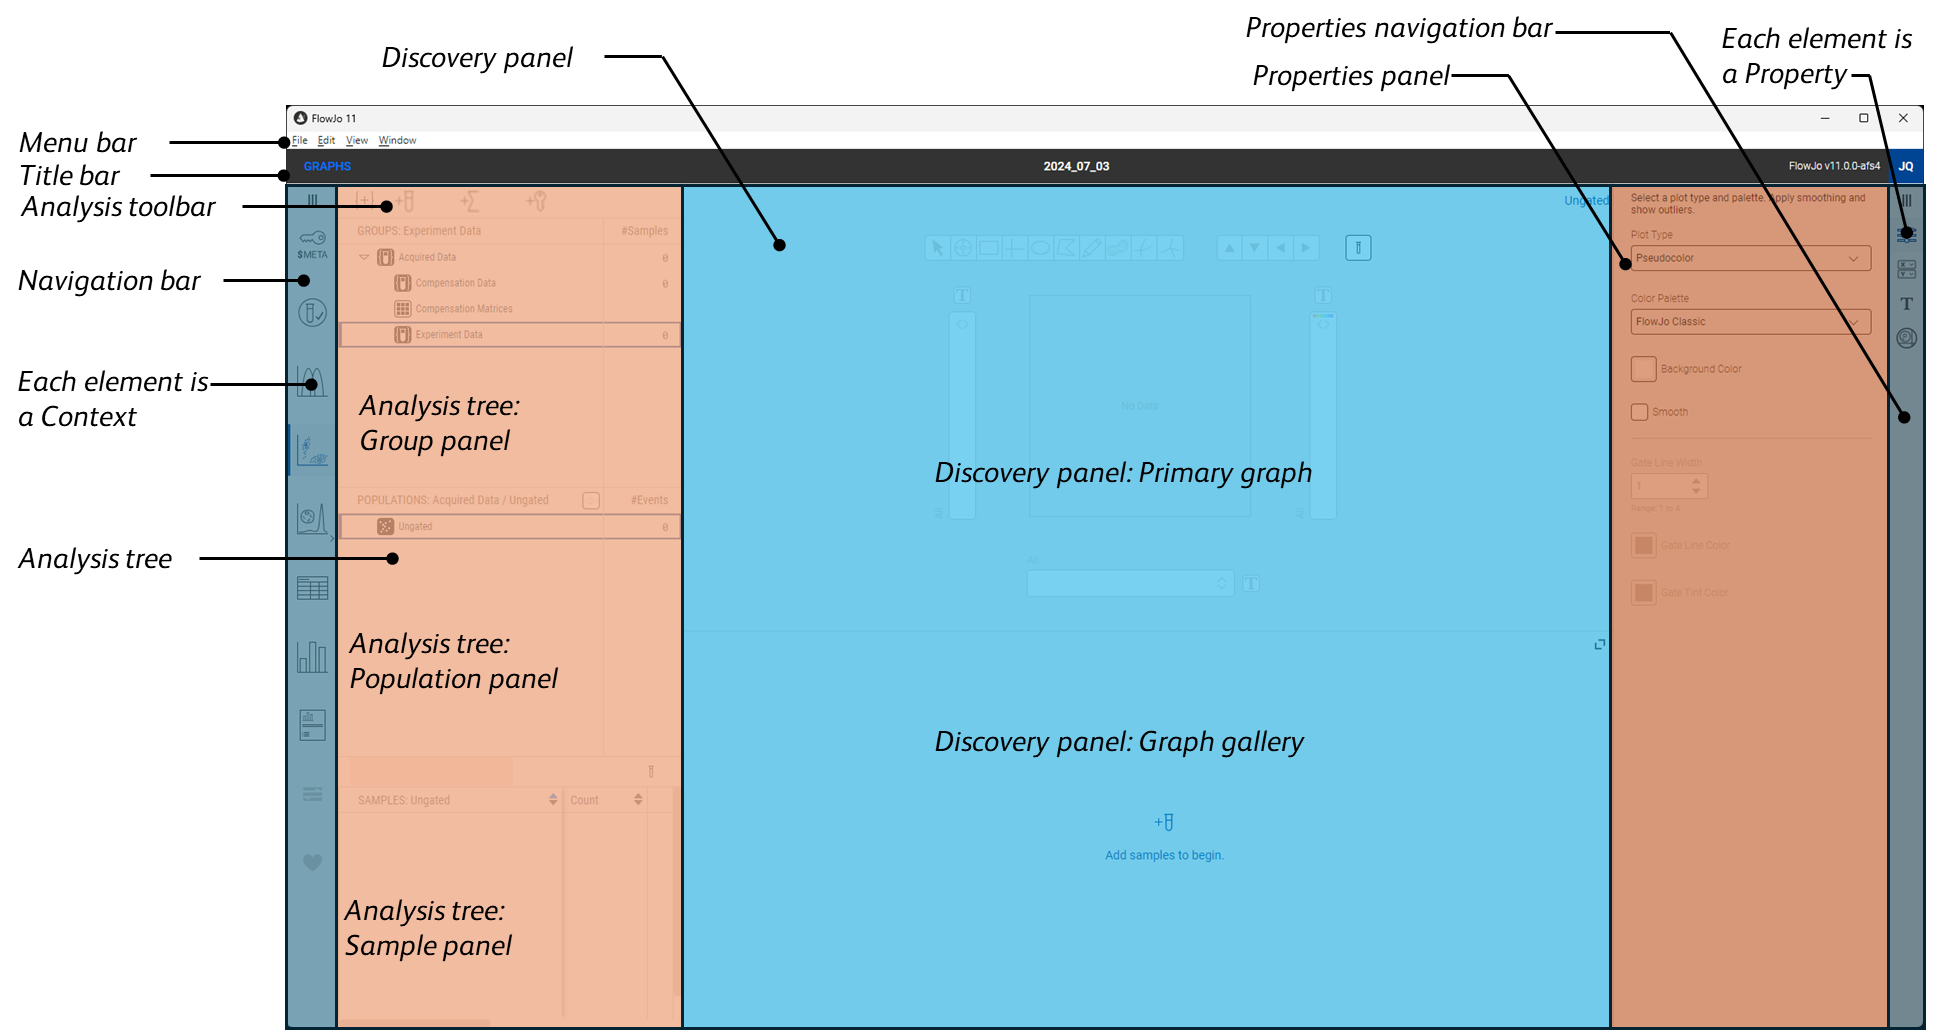
The structure of version 11 is meant to resemble your lab bench; the bulk of the work is done in a flexible space in the center with your tools neatly tucked away to the left and right to be picked up and used on an as-needed basis as your context changes. Figure 1 illustrates the components on a high level. Everything revolves around the Discovery Panel, both literally and figuratively.

Figure 1. High level components
Menu Bar
The Menu bar provides access to a few high-level tools, such as the theme colors of the workspace and save options.
Title Bar
The Title bar provides information about the version of FlowJo, the workbench name, and any alerts.
Navigation Bar
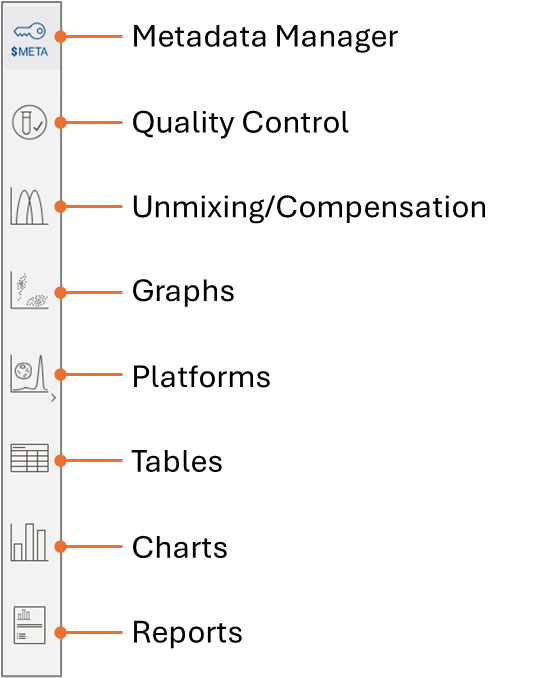
The Navigation bar controls the context of what will be displayed in the Discovery panel. The contexts are ordered from top to bottom in what we expect is a reasonable default workflow. Figure 2 shows the definition of each icon.

Figure 2. Navigation bar contexts
- Metadata manager: Begin your analysis by adding or editing keywords to supplement the information written into your data. The Metadata manager also includes tools to modify the parameter names, and to create parameter sets, which are focused subsets of the total set of parameters meant to expedite analysis.
- Quality control - Do automated data cleanup using this tool to remove any artefacts introduced during acquisition.
- Unmixing / Compensation: This context provides tools for either unmixing/compensation or viewing/editing of an acquisition defined matrix.
- Graphs: Explore your data with interactive graphing and gating.
- Tables: Create tables of statistics by dragging and dropping populations and samples to create columns and rows respectively.
- Charts: Create visual representations of your tables by generating a chart from any table you have created.
- Population Explorer - Deep dive on a sibling populations, such as the output of a cluster analysis, to understand the relationship between these populations.
- Reports: Arrange your gates, tables, charts, and other collateral from analysis into a report that explains the data. Batch pages of the report to quickly expand the presentation to include many samples.
- Preferences: Having completed the journey through your data, adjust any default settings based on what you have learned to improve your next workflow.
Analysis Tree
The analysis tree is the database of your FlowJo workbench, and the controller throughout the program for what data are being worked on. It organizes your data at three levels.
- Group panel: Use this section to put your samples into functional groups. Whatever happens to a group happens to all of the samples in it. All acquired data is divided into either a compensation control or experimental data. You can further sub-divide the data hierarchically.
- Population panel: Any gates drawn on data appear here, colored based on which group they are associated with. Clicking on a group filters the gates based on which group they are associated with.
- Sample panel: Displays the samples associated with the currently selected group.
Discovery Panel
The discovery panel displays whichever context is selected in the Navigation bar.
Properties Panel
Properties panels will vary based on which context is selected, and which property is selected from the Properties navigation bar. Typically these properties add finer levels of control and adjustment are achieved.
Properties Navigation Bar
The Properties Panel contents are controlled via the Properties Navigation bar. Select a property from the side par to bring that set of tools into focus in the panel. The contents of the bar will vary with context.
