The wizard allows you to create a spillover matrix largely automatically, but with more oversight than fully automatic unmixing.
The Compensation Wizard will automatically assign single stain controls to detectors, create clean-up gates, create positive and negative gates if AutoSpill is not used, and identify universal negatives. It will also pause in the calculation to allow you, the expert, to make any corrections you deem necessary before proceeding to either creating or previewing the spillover matrix.
Use
Begin using the wizard by:
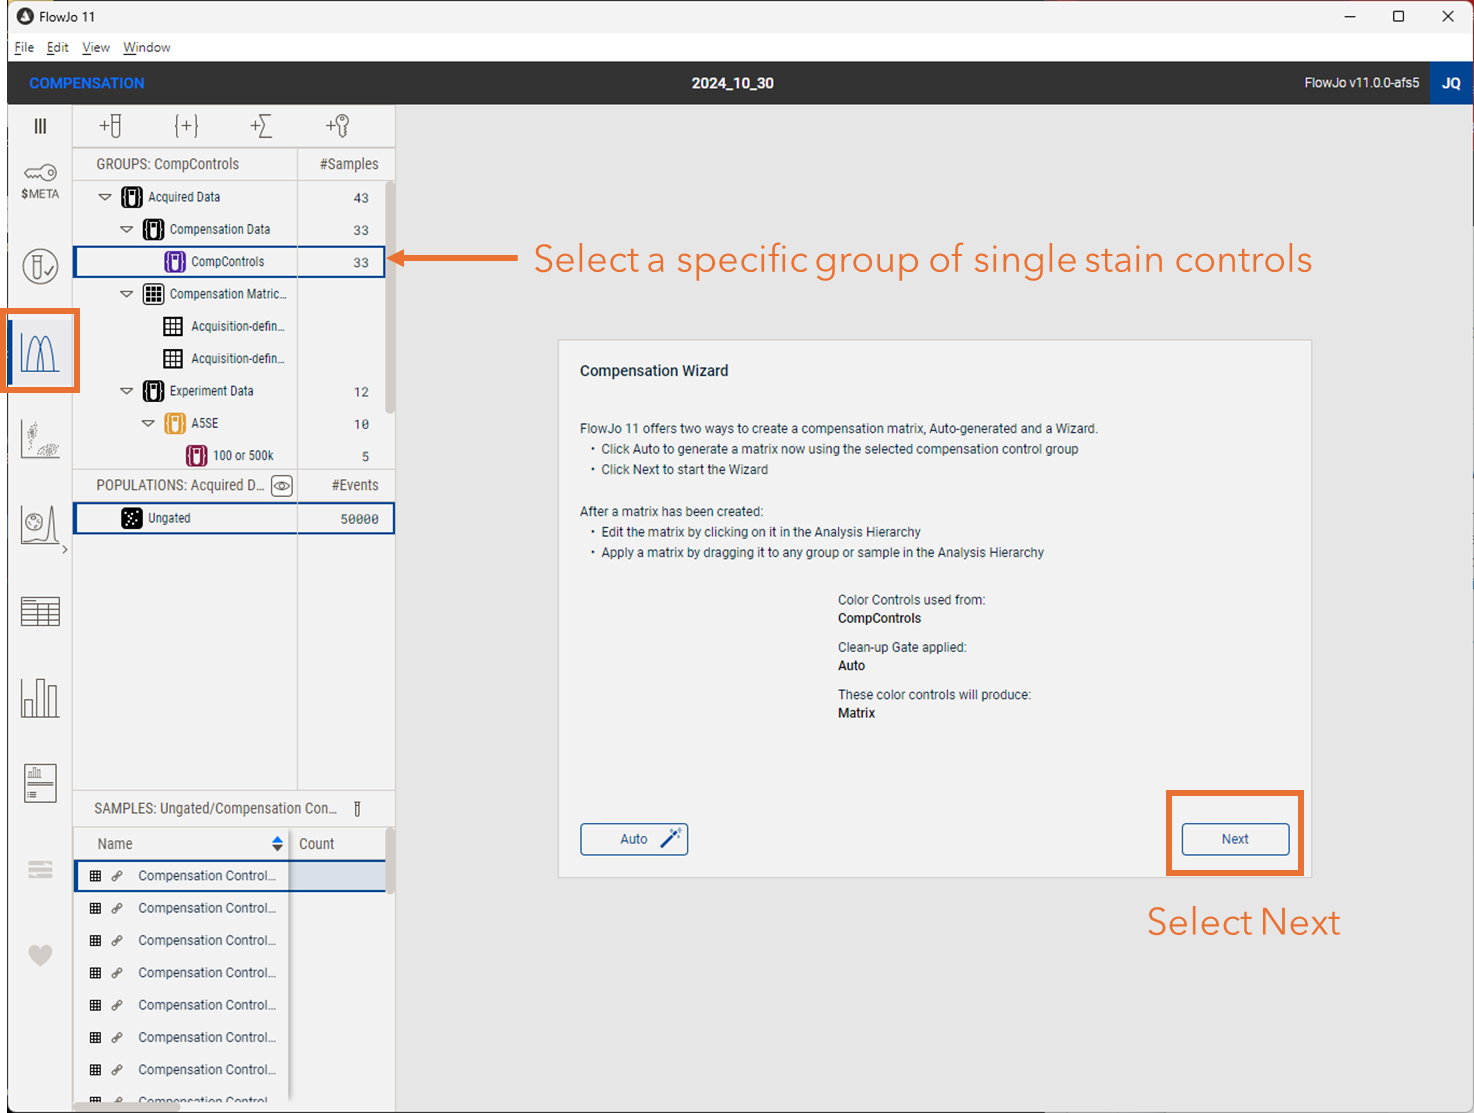
- Selecting the Compensation Context from the context bar, as shown in Figure 1
- Select a specific group of single stain controls from the Compensation Data group
- Click the Next button to proceed, also highlighted in Figure 1

Figure 1 initializing the Compensation Wizard
The wizard will next match single stain controls with detectors based by pairing the samples with the brightest signal in a given detector. It will also draw a size based clean-up gate on each sample, attempting the gather a large population of cells with similar scatter intensities that include the positive peak used to align the sample with a particular detector. Scatter intensity is used to define the clean-up gate as cells with similar scatter profiles tend to have similar sizes and complexity, resulting in similar auto-fluorescence. Equal contribution of auto-fluorescence for all populations identified on a single stain control allows the algorithm to do calculations on the signal produced by the fluorochrome, rather than the fluorochrome and some variable amount of background.

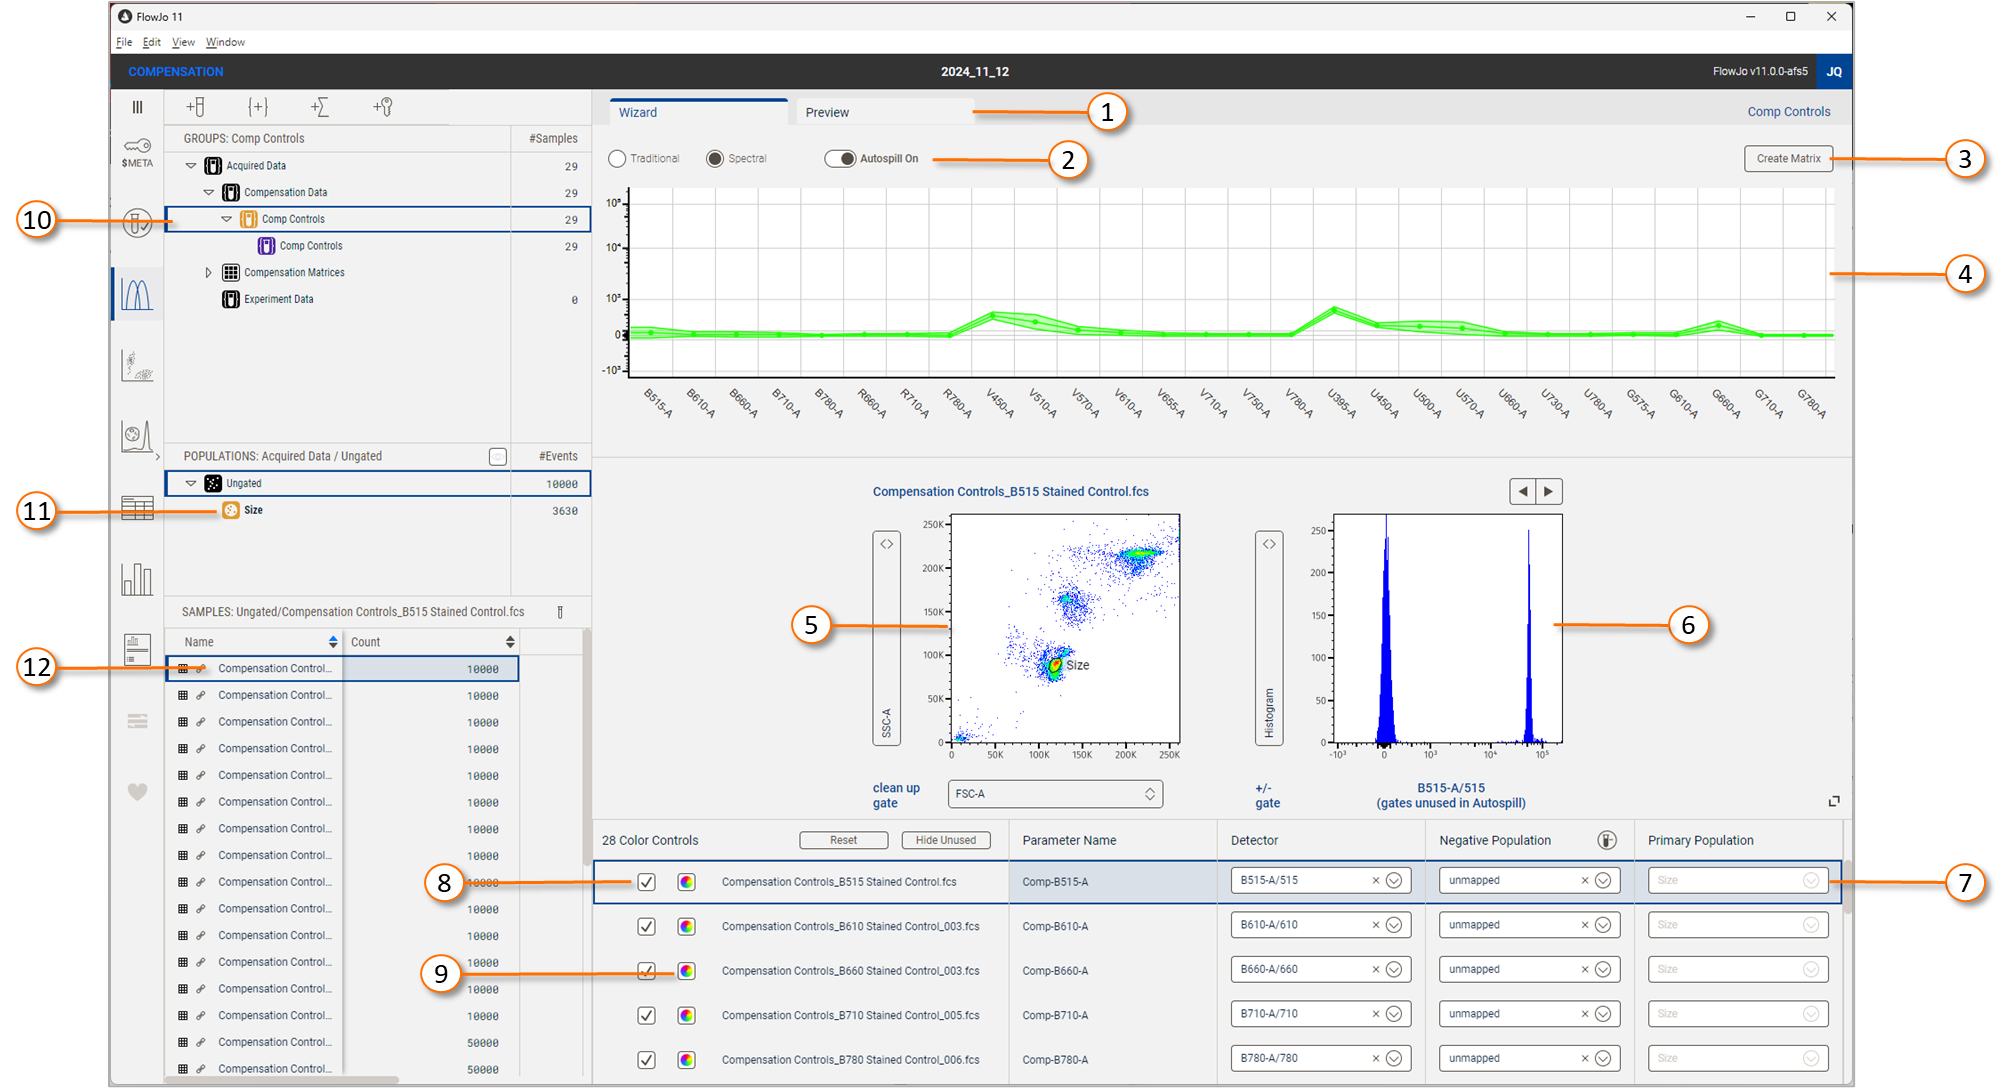
Figure 2 The Components of the Wizard
| No. | Component |
|---|---|
| 1 | Wizard / Preview tab |
| 2 | Traditional vs. Spectral & AutoSpill vs. Gate Based selector |
| 3 | Create matrix button |
| 4 | Spectral plot, displayed if spectral option is selected |
| 5 | Graph of clean-up gate for selected sample |
| 6 | Graph of primary population for selected sample |
| 7 | Selected sample with detector and population assignments |
| 8 | Use this sample in creating a matrix check-box |
| 9 | Color controls vs. unstained control selector |
| 10 | Selected group of compensation controls |
| 11 | Automatically generated clean-up gate |
| 12 | Selected sample. Hierarchy can be used for selection throughout |
By default "AutoSpill on" and "Spectral" are selected. You may modify either of these from the selectors identified by the 2 in Figure 2. In spectral mode, the spectral plot will be displayed at the top of the wizard (element 4 in Figure 2). File selection for the spectral plot is controlled via the sample assignment portion of the Wizard (element 7 in figure 2) or the hierarchy (element 12 in Figure 2).
The spectral plot shows the median intensity of cells in each detector from the selected sample. It can be used to assess the quality of a control or whether a single stain control has been assigned to a proper primary detector.
Below the spectral plot are a pair of graphs displaying any gating used on the selected sample. Element 5 from Figure 2 shows the clean-up gate. All modes of unmixing/compensation rely on a clean-up gate for isolating cells of similar size and complexity and thus similar amount of autofluorescence. By default the gate will be drawn on the first forward and side scatter parameters found in the data file. You may use the parameter selector to change parameters and draw a different clean-up gate. Simply click on the graph to begin drawing a polygon gate.
Element 6 is the positive & negative gate tool for gate-based unmixing. This graph will not contain gates when using AutoSpill as regression replaces gates in this approach. For gate-based unmixing a positive and negative gate will automatically be created. You may click on an existing gate to modify it, or click elsewhere on the graph to draw a new gate to replace one of the exiting gates. On completion of drawing a new gate a dialog box will pop up asking you to specify which gate you are replacing. You may change the Y-axis parameter to any other parameter to make 2D positive/negative gates. The X-axis parameter is fixed, and controlled by the detector selection made for the sample.
Elements 8 and 9 control whether a sample is used to create a parameter and whether it is an unstained control, respectively. Unchecking the element 8 box means the sample will not be used to create a parameter. Clicking element 9 will toggle between either a colored or gray icon. The gray icon indicates that a sample is an unstained control. Anything marked as an unstained control will be available for selection as a negative population from either the test tube in the header which will set the entire column to have a uniform negative, or from a samples drop down menu, to set the negative population for that specific sample.
All of the gates created by the wizard are uniformly named but are unique to the sample, hence the initial bolding. Importantly, gates can be dragged from sample to sample, or to the group, to apply either a uniform change or to copy a modification to a specific file or files.
When you are pleased with the detector assignments and (if using gate-based unmixing) the positive and negative gates for each sample, click the Preview tab (element 1) to check the matrix, or simply the Create Matrix button (element 3) to create a new matrix without previewing, and return to the graph window.
Click to continue to the Matrix Preview.
