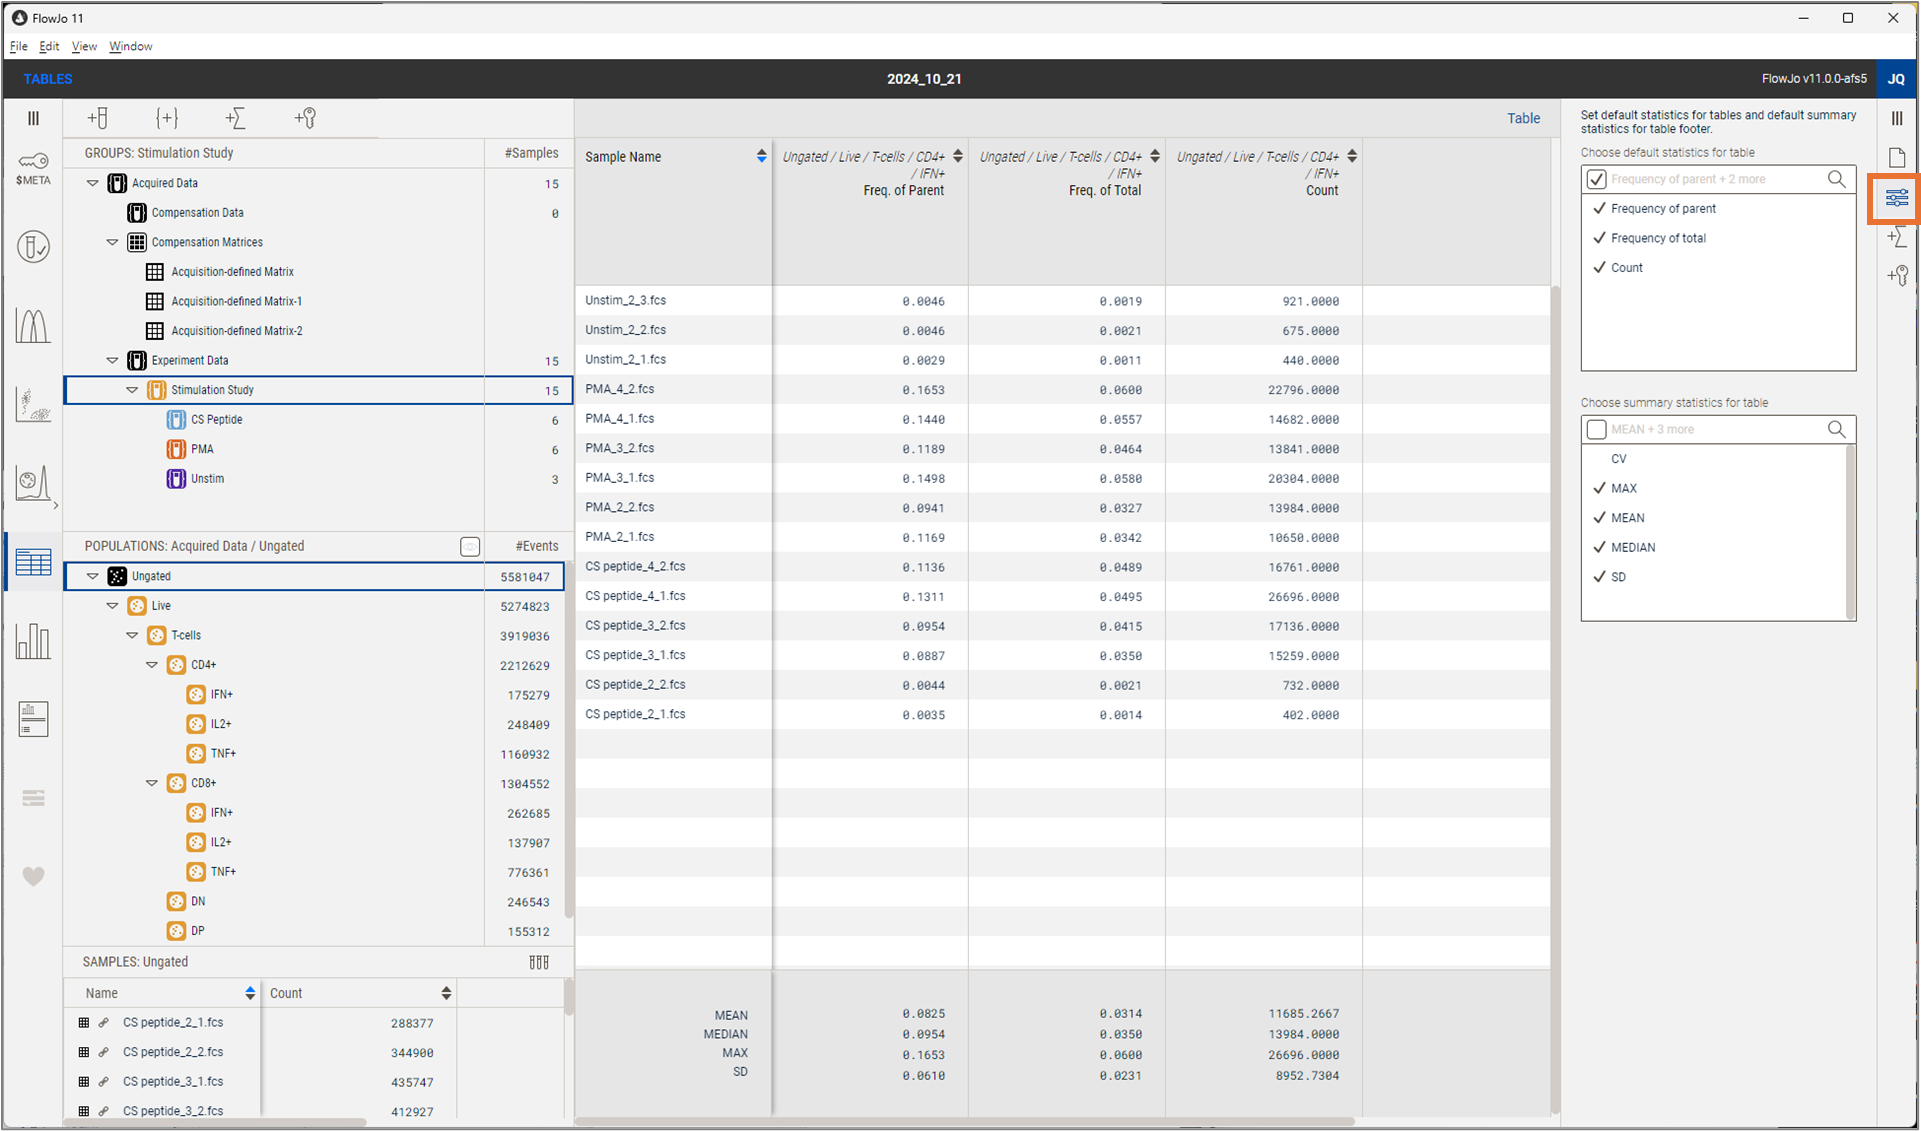
The settings property in the table editor allows you to define the default statistic(s) and choose summary statistics.
The settings property, as shown in Figure 1, contains two selection boxes. The top box defines which statistics will be used when a population is dragged to the table. You may select more than one. The checkbox in the search bar allows you to select or de-select all at once. In Figure 1, all three are selected so when the population IFN+ is dragged to the table, three columns are created, one for each statistic, all on the IFN+ population. If more than one population is dragged in, three statistics would be produced per population if all three defaults are checked.

Figure 1. Table Editor Settings Properties
The default statistics are:
- Frequency of parent - the number of events in the selected population compared to the number of events in the population directly upstream.
- Frequency of total - the number of events in the selected population compared to the number of events in the ungated population
- Count - the number of events in the selected population
The lower box defines which summary statistics will be added to the bottom of the table. All that are checked will be added, and the selection is live so that you may update your selection at any time. Observe that in the example shown in Figure one all but CV are checked, so all summary stats but CV are displayed.
The default summary statistics are:
- Coefficient of variation (CV) - the ratio of the standard deviation (SD) compared to the mean for all of the values in the column. CV's are relative to the magnitude of the measurement being made, allowing for the comparison across different measurements, assuming all measurements are on scales with a meaningful zero. Smaller values imply more consistent measurements.
- Maximum value (MAX) - the largest value in the column
- Mean - a metric of central tendency. The mean is the sum of all values in the column divided by the number of values.
- Median - a metric of central tendency. The median is the middle value, if all of the values in the column were ordered by magnitude. Median is useful because it is not impacted by a few large or small outliers as the mean will be.
- Standard deviation (SD) - a measure of how dispersed the data in the column is from the mean. It is calculated as the square root of the average deviation from the mean. Smaller values imply more consistent measurements.
More information on tables includes:
- Tables Overview
- Tables Statistics Properties Panel
- Tables Keywords Properties Panel
