Description
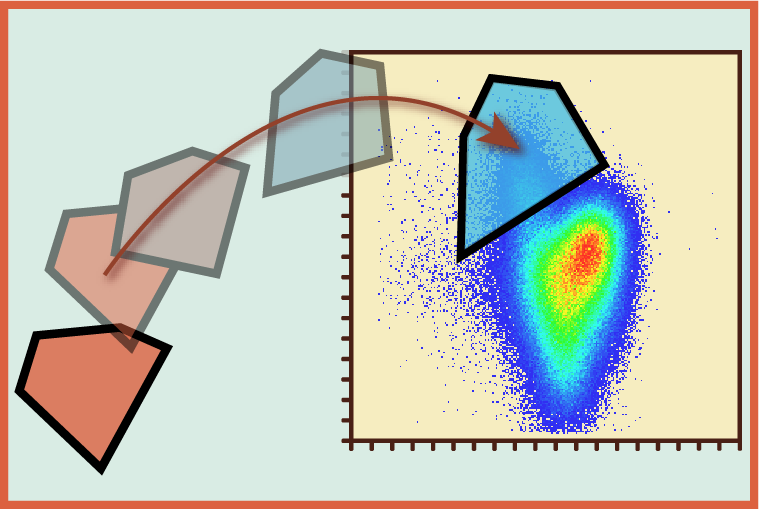
Represents plots as images and compares images of new plots to those of pre-defined training plots with pre-defined gating rules and hierarchy. The algorithm adjusts gates in 1-dimensional data by comparing histograms. Gates originally established on the training file(s) are locally and globally adjusted in each test file based on how data shift and contort between the training and test files. Local shifts in data on plots are modeled using elastic image registration. A transformation is determined that warps the training data plot to look like the new ungated plot, then the same transformation is applied to the gate vertices. This allows gate vertices, for any gate shape, to follow shifts in the nearby data and maintain gate ‘cutoffs’ intended by the user. No assumptions are made about population shapes, and peak-finding and density cutoffs are not used. The user can review all results and manually correct any gates if necessary.
Algorithm Authors
Allison Irvine
Plugin Developers
Applications
Categories
Utilities
Visualization
