
What is CytoNorm?
The CytoNorm algorithm has been developed and implemented as an R package by Sofie Van Gassen PhD, from the Saeys Lab out of the University of Belgium, in Ghent. The purpose of the tool is to normalize batch effects in flow cytometeric datasets collected in different batches, based on a similar set of controls run with each batch. CytoNorm works best if a control sample is provided for each batch. These control samples are used to normalize each batch to a common FlowSOM ‘spline’. (1)
The CytoNorm plugin requires that each sample – both controls and different batches – contain a common parameterset named exactly the same for each FCS file.
CytoNorm has been implemented as a “Workspace Plugin” for FlowJo. This allows the plugin to run by accessing datasets to be used in normalization, as opposed to a particular single population in the workspace (a “population plugin”). It also means that the plugin must be run with a slightly different workflow.
To run the plugin:
1. Install R version 3.6 (or greater).
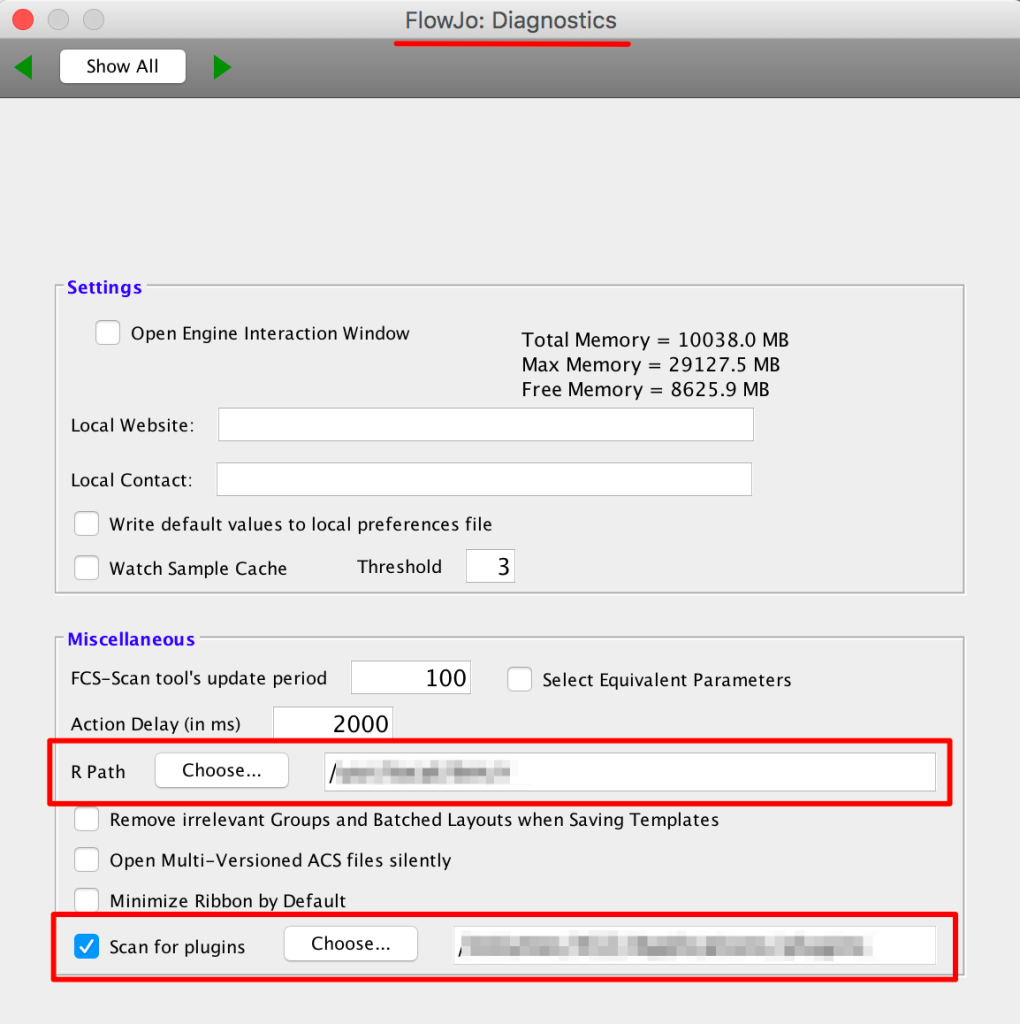
2. Make sure your R path is specified in the Diagnostics section of FlowJo’s preferences.
3. Point FlowJo to your plugins folder (also in the Diagnostics preferences):
 4. Place the CytoNorm plugin’s JAR file into your plugins folder
5. Restart FlowJo
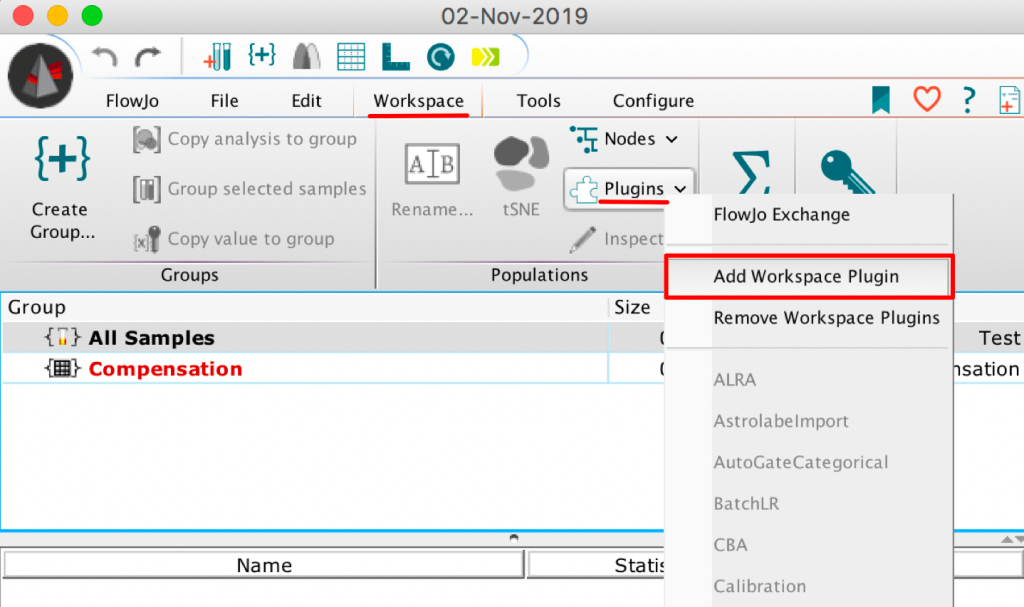
6. Within theWorkspace tab of a blank workspace, select the Plugins option, and choose “AddWorkspace Plugin”:
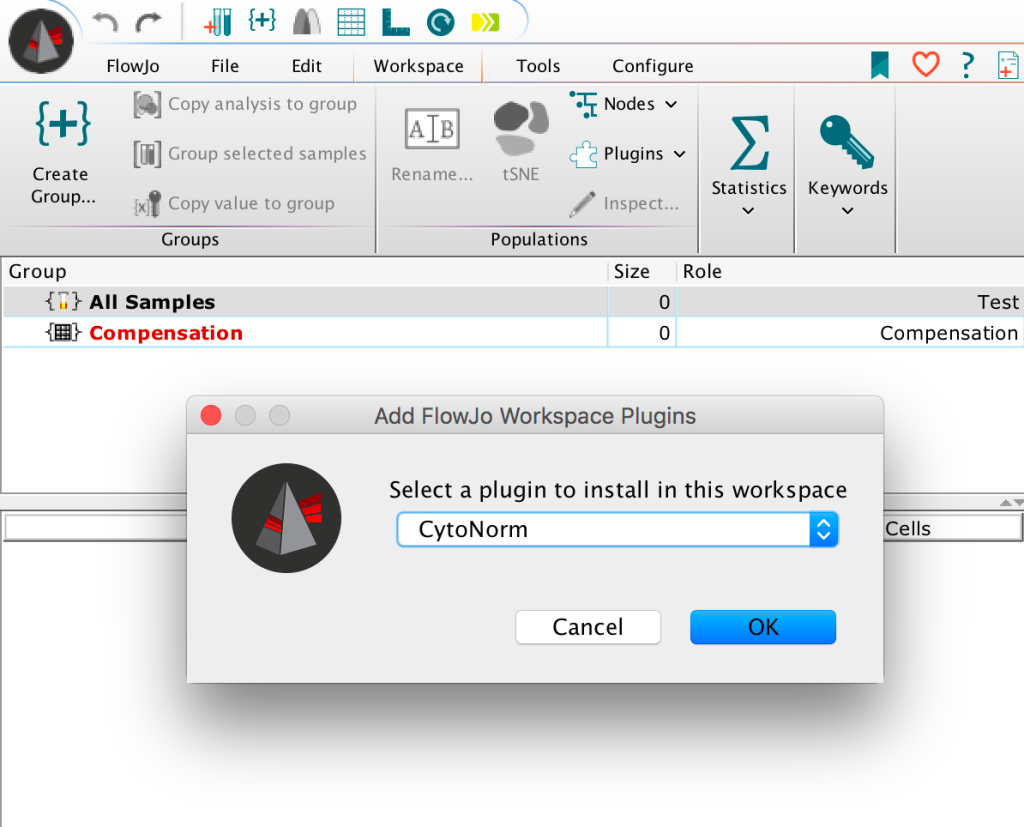
 7. Select the CytoNorm workspace plugin option:
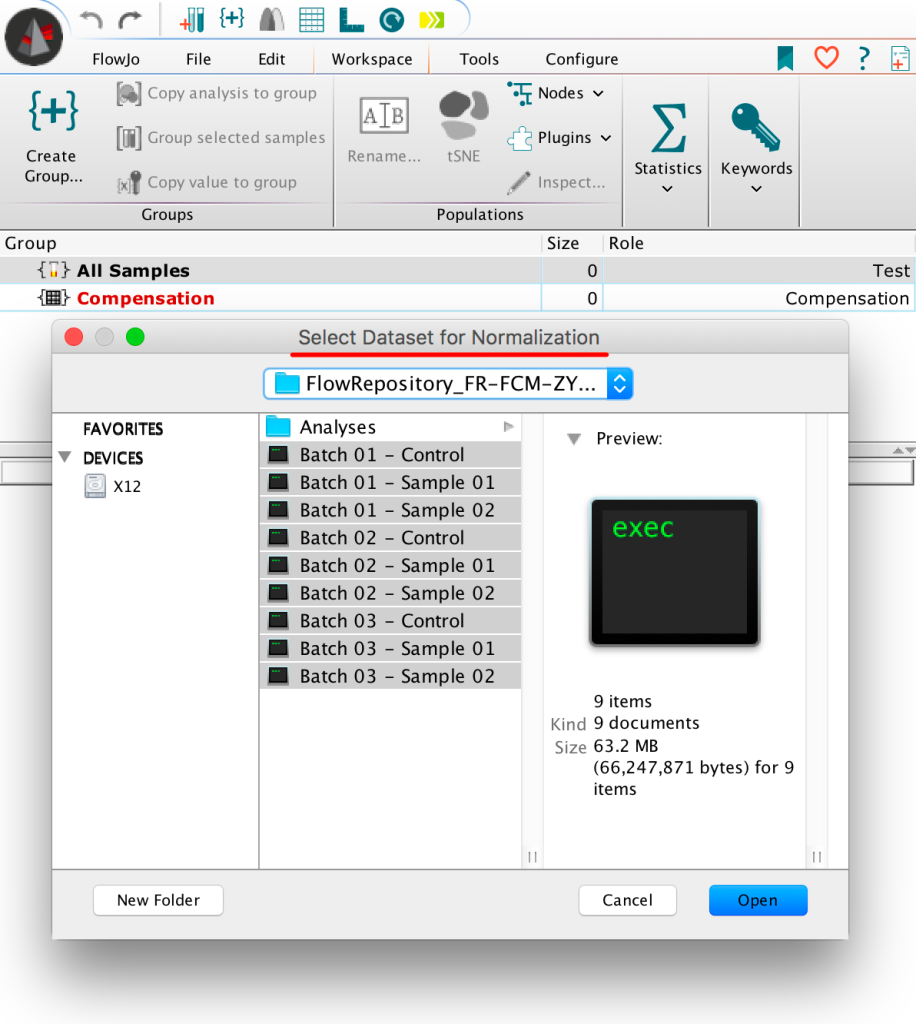
 8. This will launch a file browser to search for FCS data, all datasets for normalization should be selected along with the associated controls:
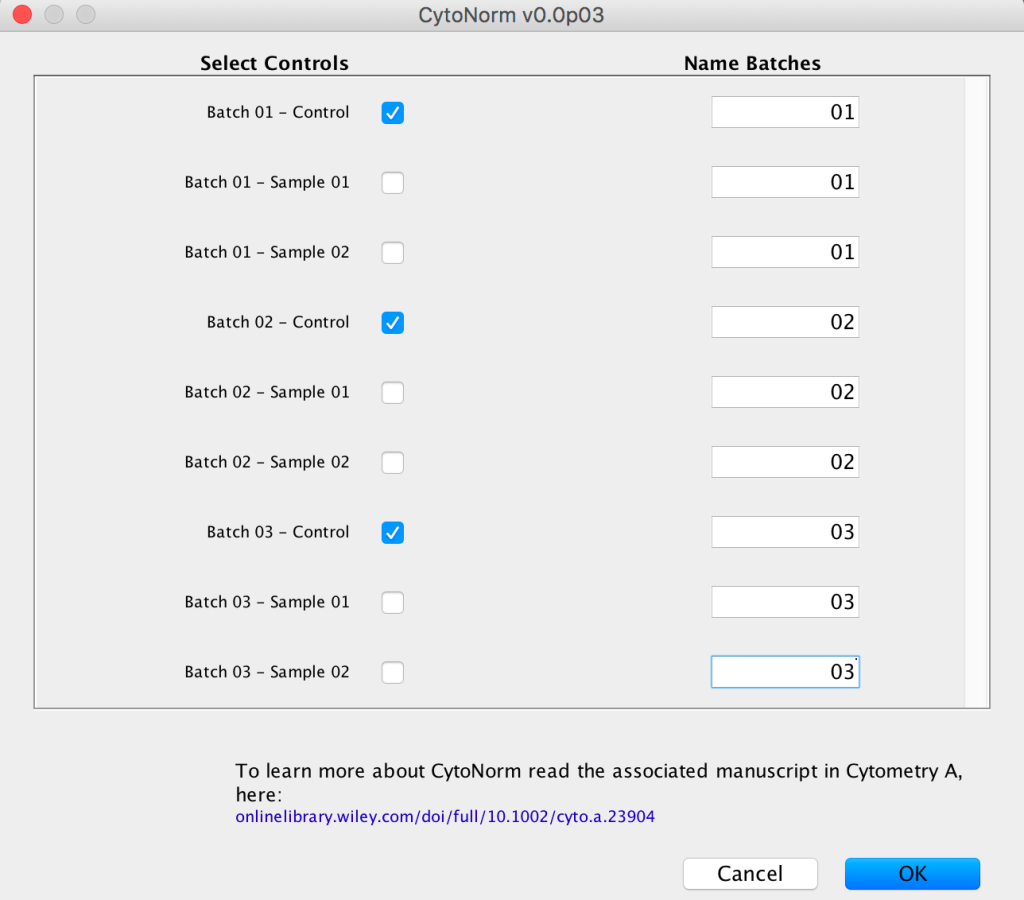
 9. Next researchers should indicate which samples are controls by checking the appropriate boxes, and entering a value identifying each sample’s batch.
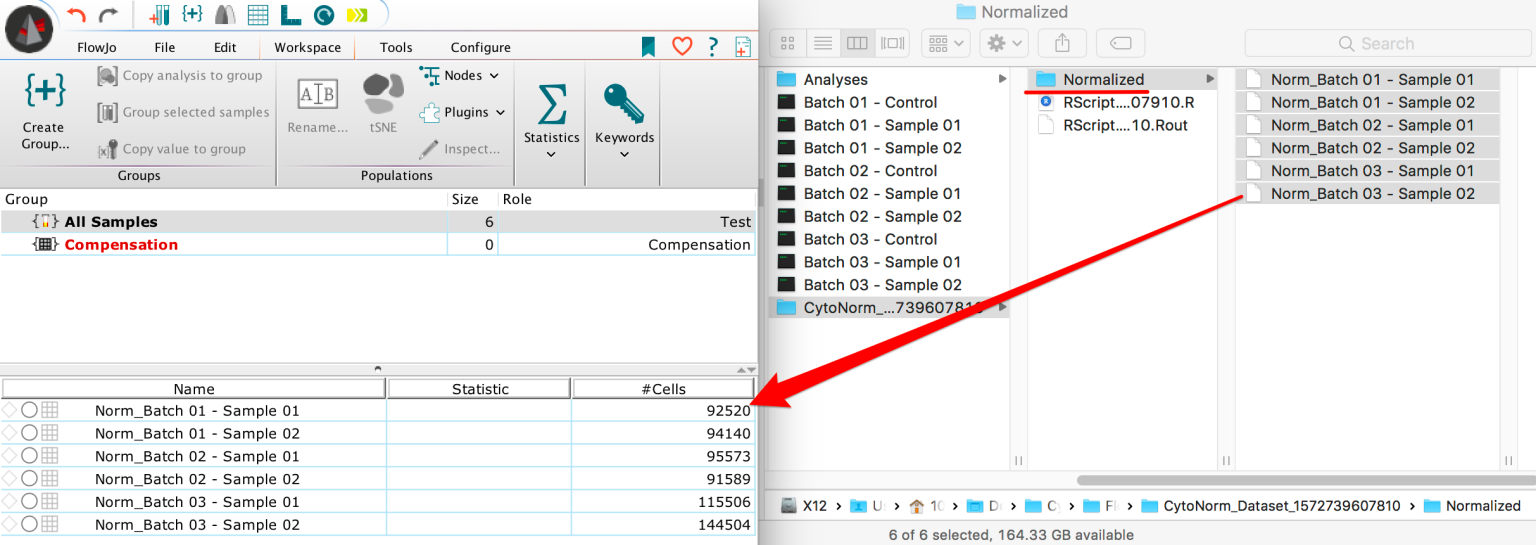
 By running the tool FlowJo should pass the path from the FCS files and their status into R. There, the CytoNorm algorithm will try to automatically install, and generate a new normalized version of the original dataset within the same location as the initial FCS dataset.
10. Finally FlowJo will open that location in a file browser and data can be loaded into the workspace for further analysis.
Benchmarking
Example 01 – Here we can see the effect of normalization in similar samples suffering only very slight batch effects, using a common tSNE embedded space:
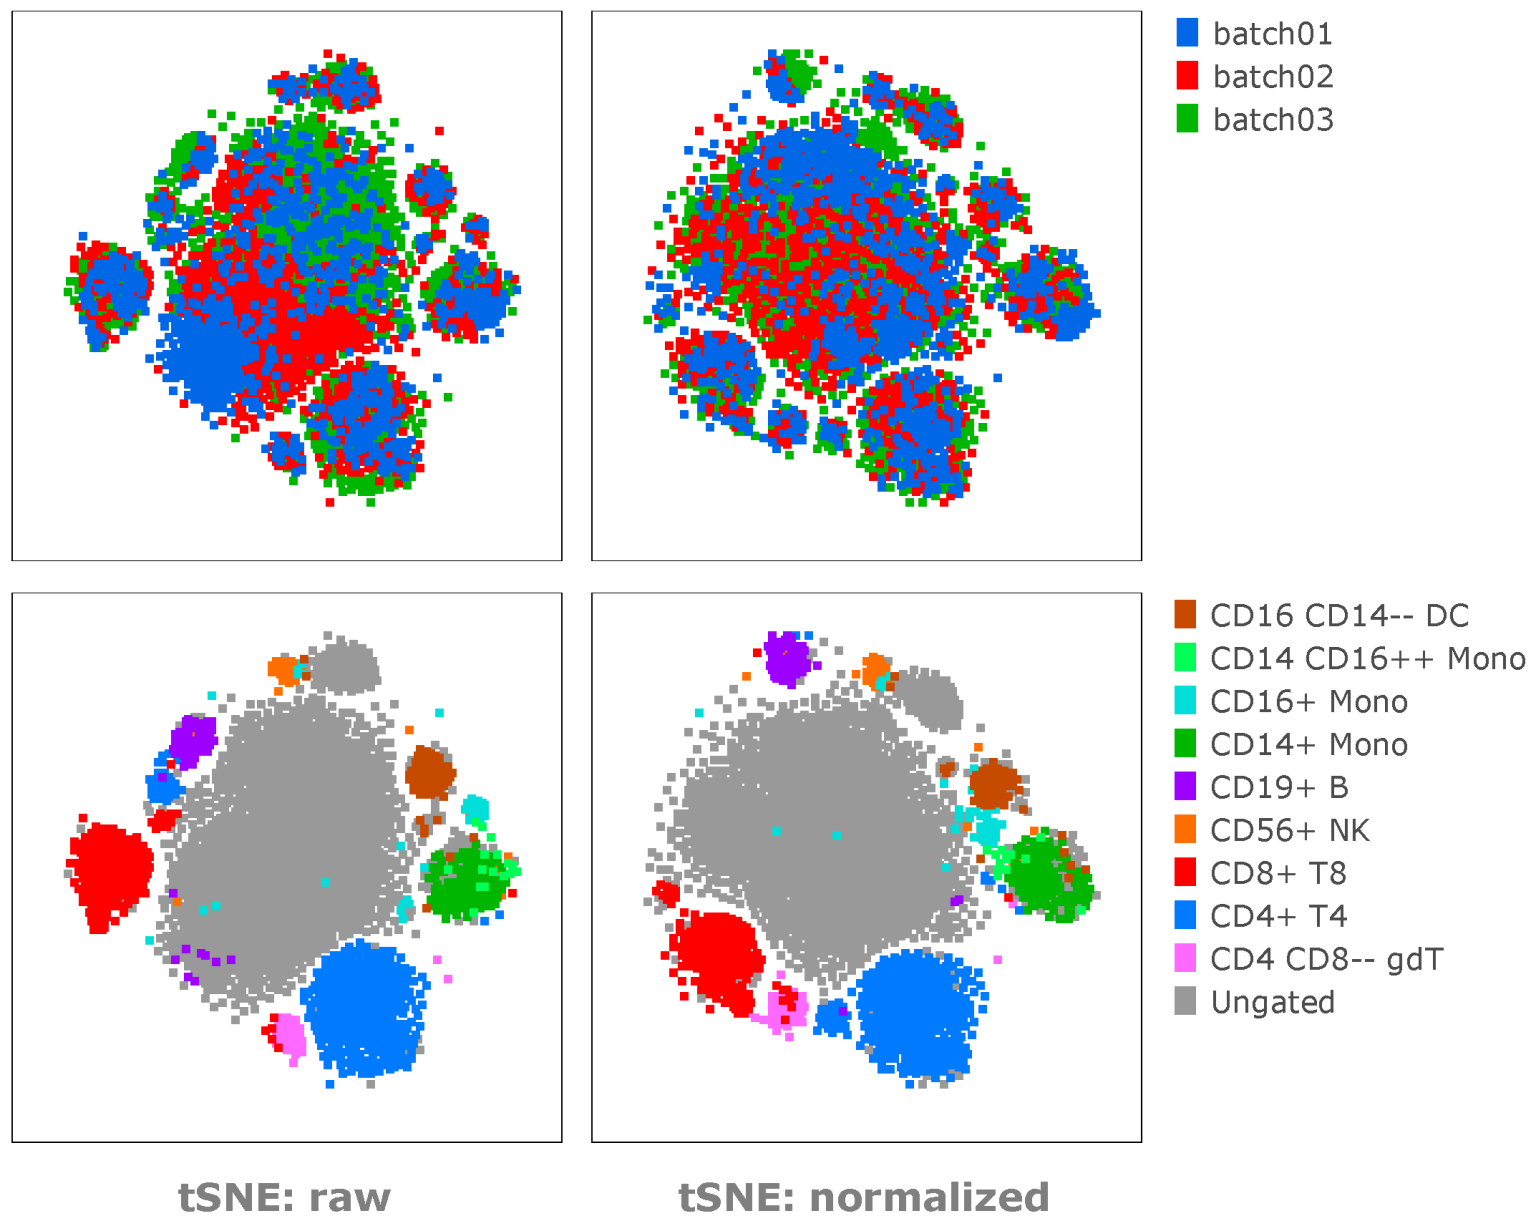
Note: The normalization helps to reduce the batch effects and move similar subsets together into the appropriate islands, or to distribute batches throughout the tSNE islands.
Example 02 – Here we can see the effect of normalization on expression of a few select parameters:
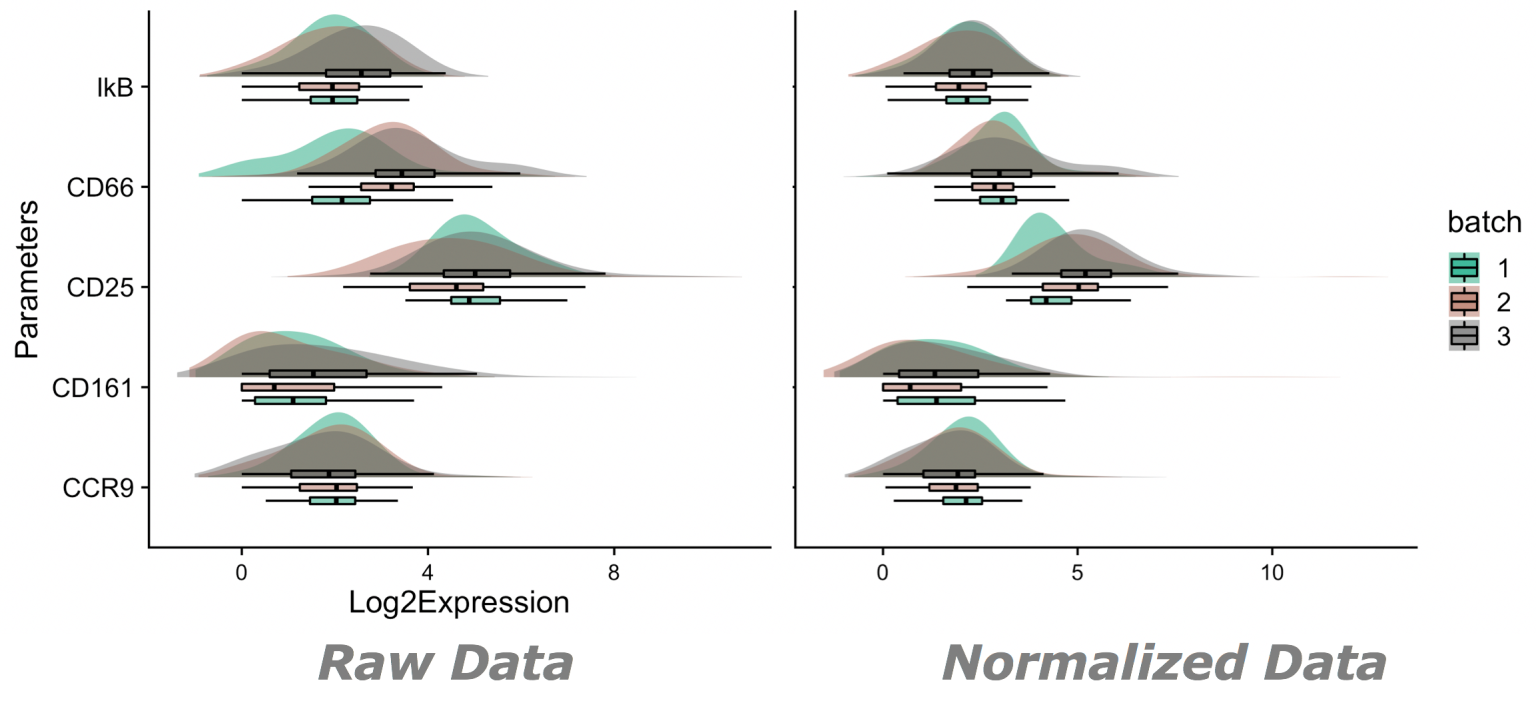
Note: Expression will not change uniformly, nor will expression necissarily move in one direction or another.
Normalized expression is expected change following changes associated with technical variability within controls. Figure for example 02 generated by the ViolinBox plotting plugin, available here: https://www.flowjo.com/exchange/#/plugin/profile?id=13
• Data for this initial benchmarking pulled from Flow Repository(2): FR-FCM-Z247(1).
References:
1. “CytoNorm: A Normalization Algorithm for Cytometry Data” Van Gassen S, Gaudilliere B, Angst MS, Saeys Y, Aghaeepour N Cytometry A. 2019
2. Spidlen J, Breuer K, Rosenberg C, Kotecha N and Brinkman RR. “FlowRepository – A Resource of Annotated Flow Cytometry Datasets Associated with Peer-reviewed Publications.” Cytometry A. (2012)
3. Conrad, Valerie K., et al. “Implementation and validation of an automated flow cytometry analysis pipeline for human immune profiling.” Cytometry Part A 95.2 (2019) FR-FCM-ZYXS
4. Source (CytoNorm GitHub): https://github.com/saeyslab/CytoNorm
Please review FlowJo documentation for installing plugins http://docs.flowjo.com/d2/plugins/installing-plugins/