
Introduction
What is This Thing?
The Euclid plugin is a sort of quality control utility for clustering. In it there are imbedded two algorithms:
ClustRCheck checks the modality of populations accross a range of parameters. Modality is defined as the result of a “DipTest” which looks for saddlepoints in data to determine if there may be extra heterogeneity within some parameters per cluster that could indicate the presence of deeper subpopulations.
Taylor Index is an algorithm and a set of statistics for checking the separation between populations in N-Dimensional space. In otherwords its like a Stain-Index but more extensible. The TaylorIndex of a clustering in high parameter space can illustrate the relatedness of populations in terms of similar expression profiles, it can also be used as a means to guague the goodness of clustering results relative to other outputs, or dimensionality reduction relative to a set of control clusters.
SetUp
Make sure R is installed on your computer and that the R path is set in the diagnostics section of FlowJo or SeqGeq’s preferences. For more information on general plugin setup, see technical documentation available here.
Load the plugin into your plugins folder, and restart the application (FlowJo or SeqGeq) to make the option available within the plugins dropdown. Selecting a clustering parent population of interest, and choosing ‘Euclid’ from the Plugins dropdownlist will launch the parameter selection dialog:
Note: Researchers can choose to run either the ClustRCheck, or TaylorIndex algorithms. They also have the option to export a set of statistical outputs as CSV files.
Output
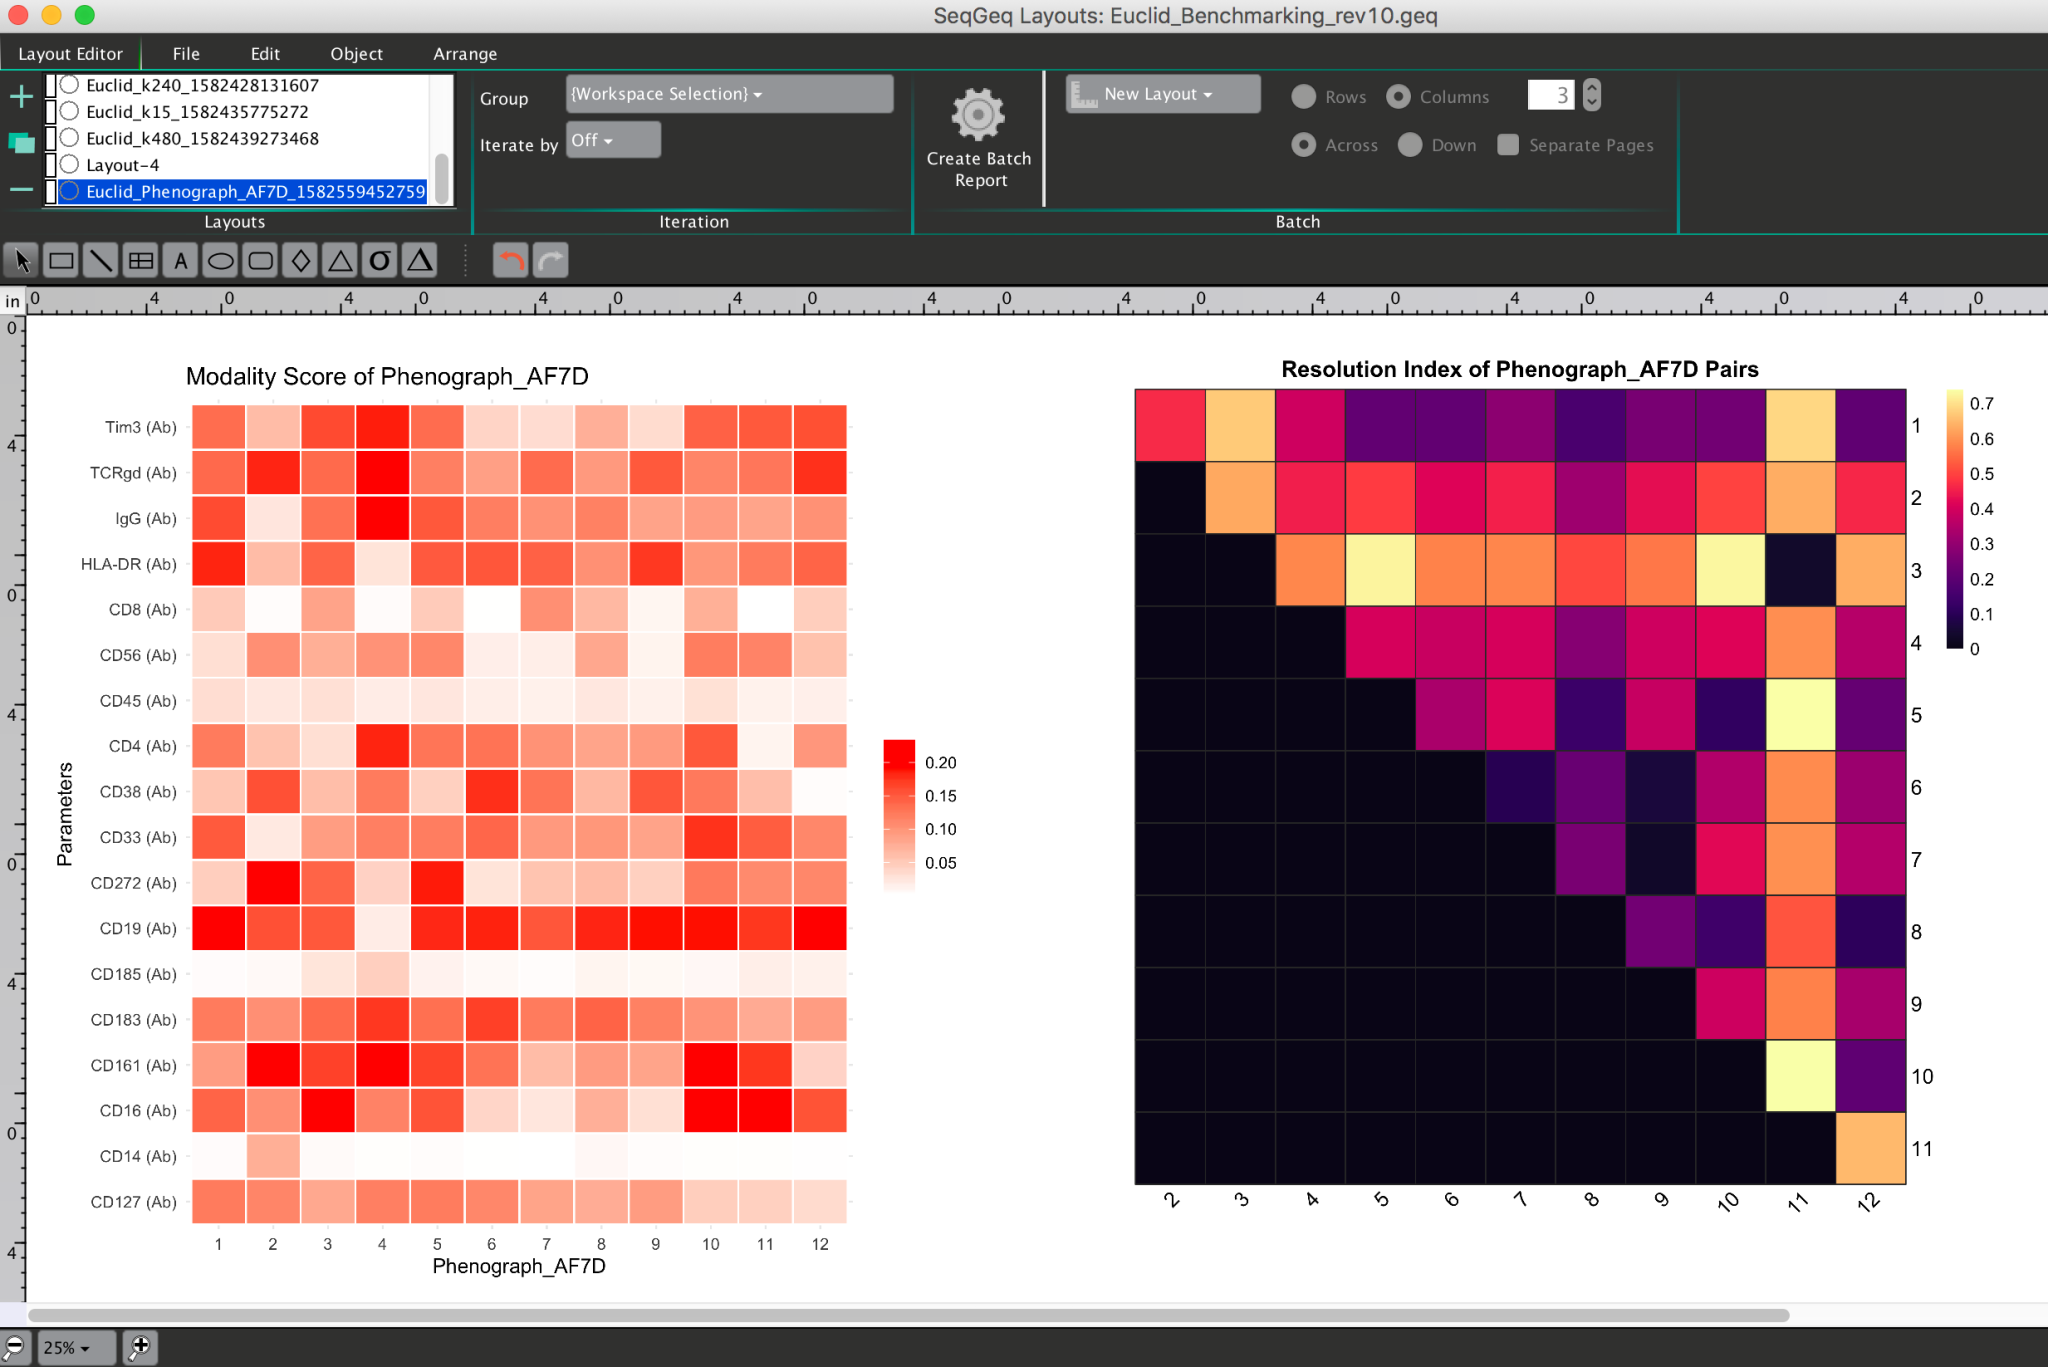
When the plugin is finished running it will create a new layout to display both ClustRCheck and TaylorIndex heatmaps:
If statistical outputs are requested, the plugin will prompt researchers to open these files within a file browser window automatically when the calculation is completed.
Use Cases
Clustering may be performed on the same datset multiple times, and knowing which clustering best separates populations from high parameter space can be a challenge. In other cases, some researchers will recursively run dimensionality reduction in order to find the option that best fits their data. If there exists a set of clusters of interest in high dimensionality space, checking the resolution of those clusters within any 2D (or even 3D) embedded space can indicate the “best” option to use for displaying those clusters.
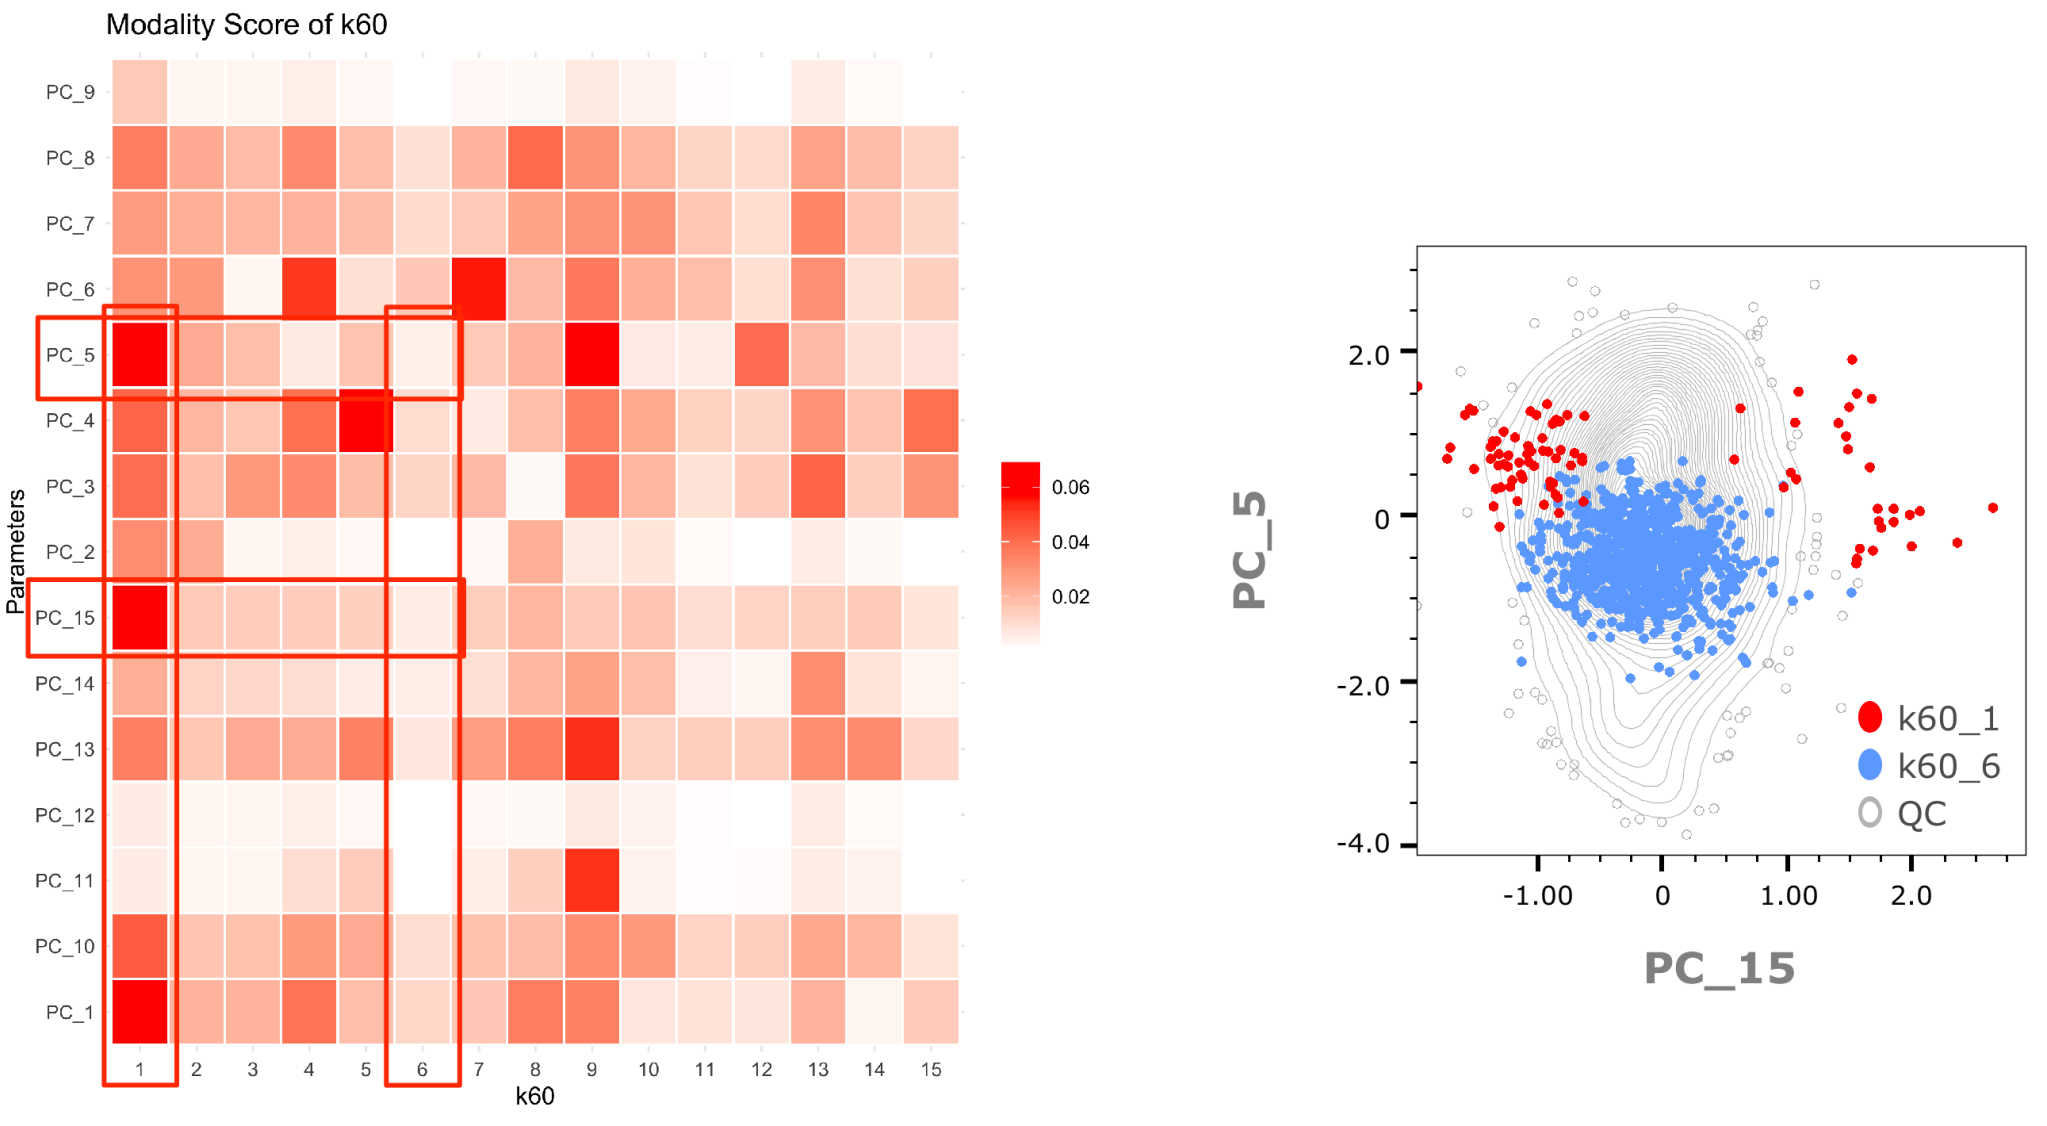
1. Discovering Deeper Subpopulations with ClustRCheck
Below we can illustrate that a population showing low modality in Principal Components (PCs) 15 and 5 is less heterogeneous than one with high modality scores for the same PCs:
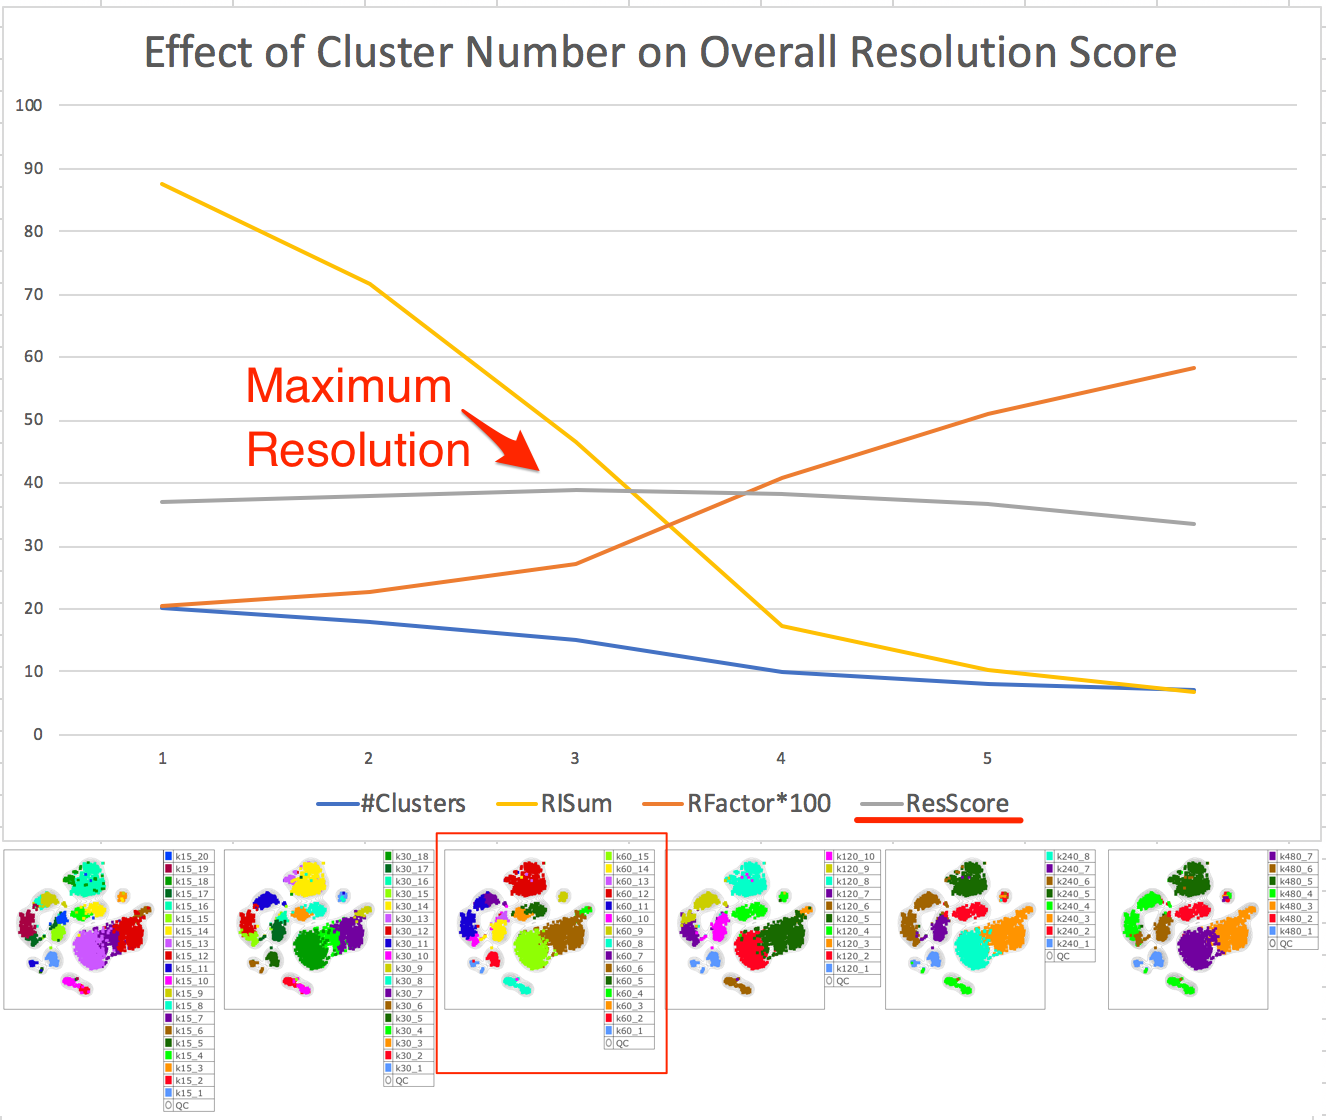
2. Comparing Clustering Results using Taylor Index
Using the Taylor score (grey line) for a set of Phenograph clustering results from calculations with different KNN values, we can pick out the clustering which gives the best separation of populations overall, while still preventing overclustering:
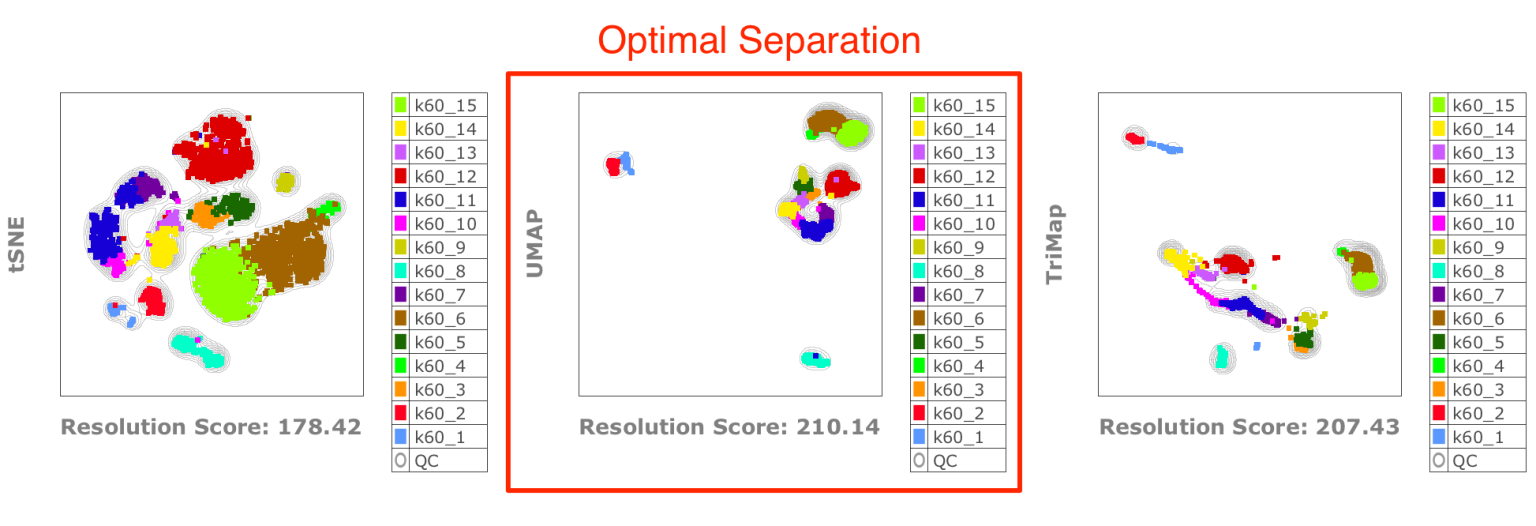
3. Testing the Best Dimensionality Reduction Outputs with Taylor Index
Using the same “optimal” clustering as in the benchmarking above, we can then test which dimensionality reduction maximizes clustering resolution in embedded spaces: tSNE, UMAP, or TriMap:
Background
ClustRCheck
The DipTest is a well known and powerful algorithm. To learn more, read up on this topic, here: Jonathan B. Freeman & Rick Dale. Assessing bimodality to detect the presence of a dual cognitive process. psych.nyu.edu/freemanlab/pubs/2012_BRM.pdf. Behav Res, 2012
This is the mathematical basis on which the ClustRCheck algorithm runs.
TaylorIndex
The TaylorIndex is a mathematical construct invented by Ian Taylor, a scientist, scholar and flow cytometry guru who formerly worked at BD Life Science – Informatics (formerly FlowJo, LLC). It is meant to provide similar information as compared to a StainIndex but with the added advantages that it is extensible to N-Dimensional space, and takes into account the width of both positive and negative populations.
A TaylorIndex is calculated for a pair of populations very simply by:
1. First obtaining the width (Distance) of clusters in terms of a robust standard deviation (intraclusterdistance), and their mean centroid position in high dimensional space. Here is a rough example illustration of such a calculation in 2D space:
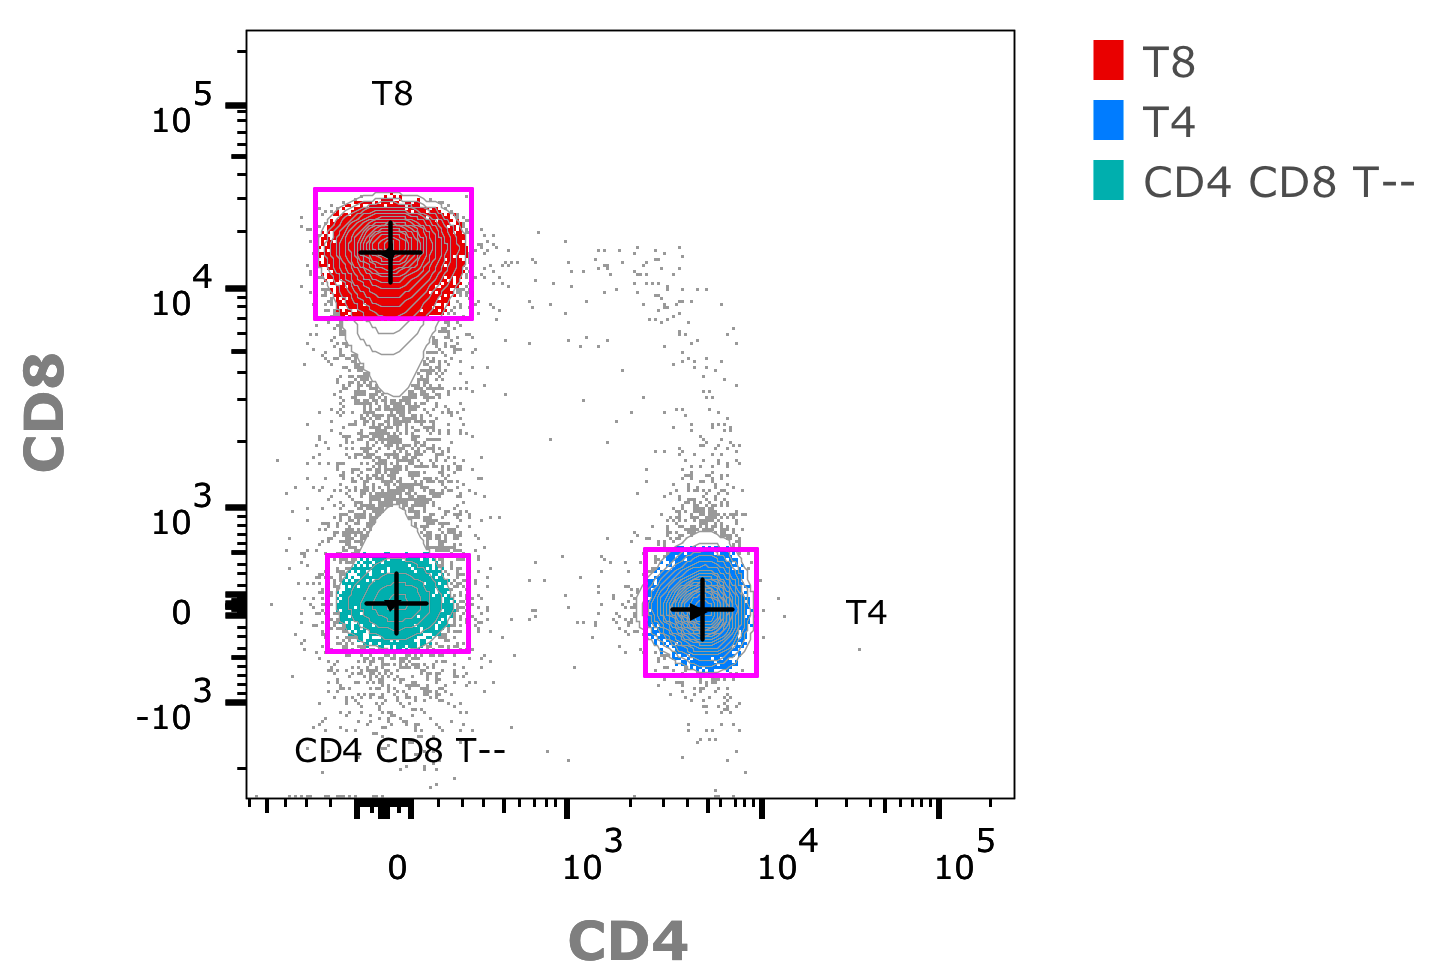
Note: The width/hieght of gates above illustrate the standard deviation for CD4/CD8 space in each of three populations, black crosses indicate the location of centroids.
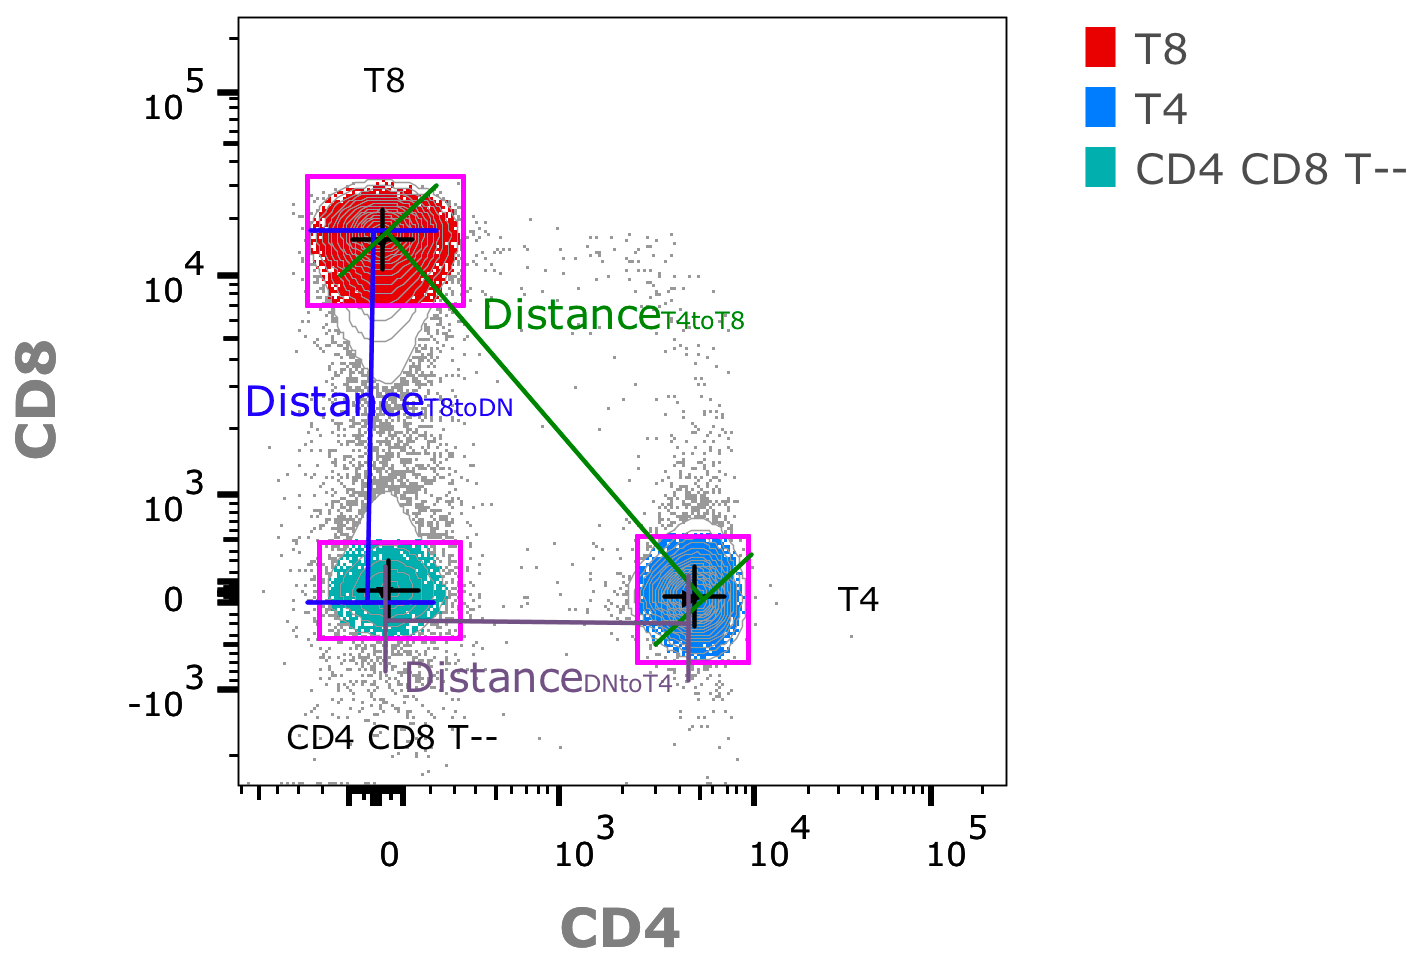
2. Calculating the distance between pairs of clusters (intercluster-distance) in high dimensional space:
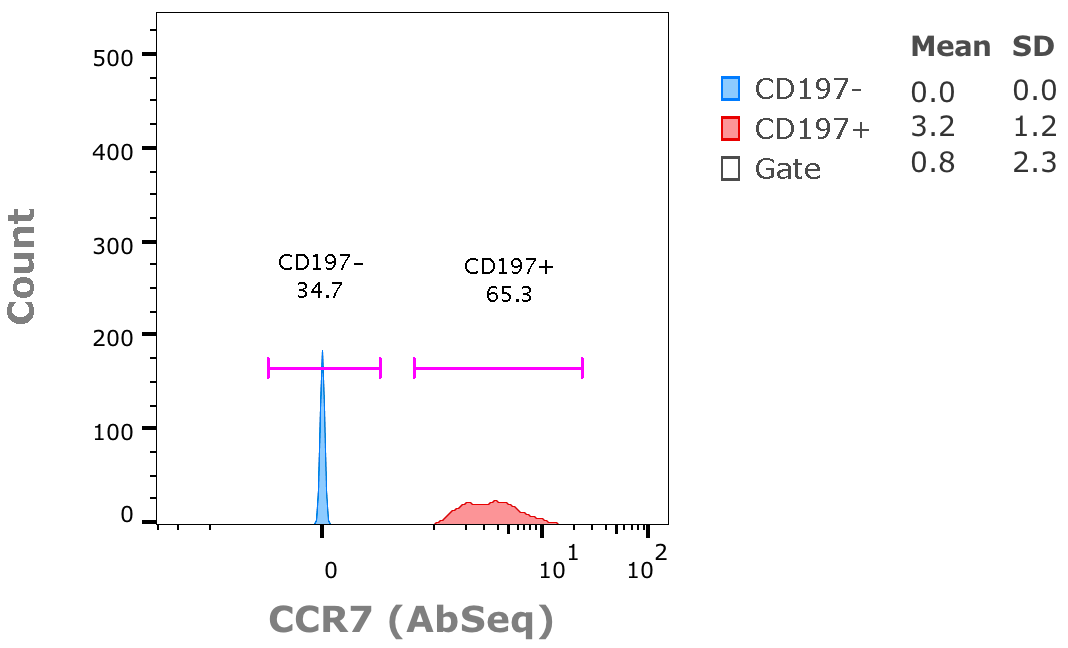
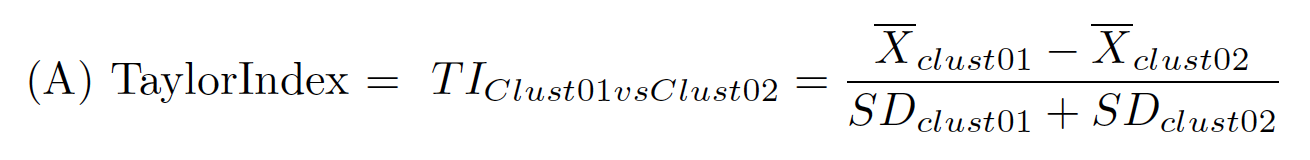
3. Taking the ratio of inter-/intra-cluster distances. Example in the 1D case:
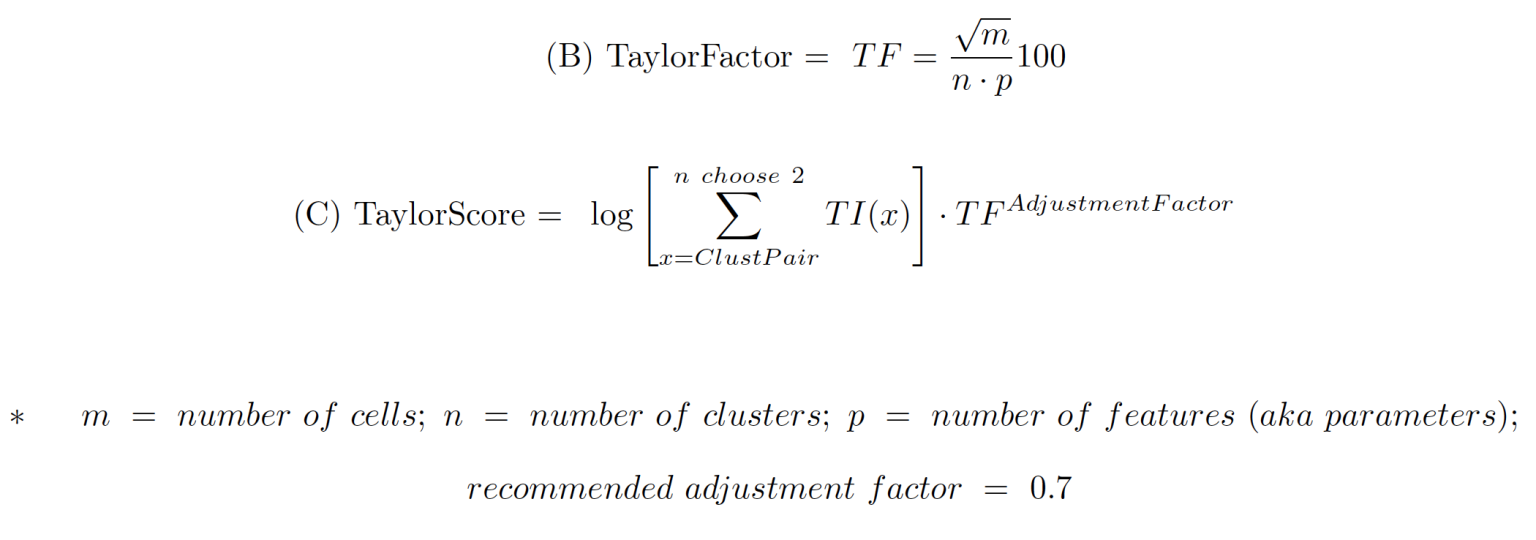
4. Overall TaylorScore is calculated in the following equations from a combination of important factors from clustering: number of clusters, number of events, number of parameters used for clustering, as well as the SUM of resolution scores:
Trouble Shooting
Common issues researchers might run into when using the Euclid plugin include:
Trouble setting up or running R based plugins. Euclid should automatically install its own dependancies, however if you need to manually install R packages, these are the required packages:
devtools, tidyverse, clustRcheck, dplyr, tidyr, ggplot2, viridisLite, ggnewscale, ggfittext.
Help!
If you have additional questions don’t hesitate to reach out: flowjo@bd.com