To view or change your gating preferences, click the preferences icon represented by a red heart outline on the workspace toolbar.
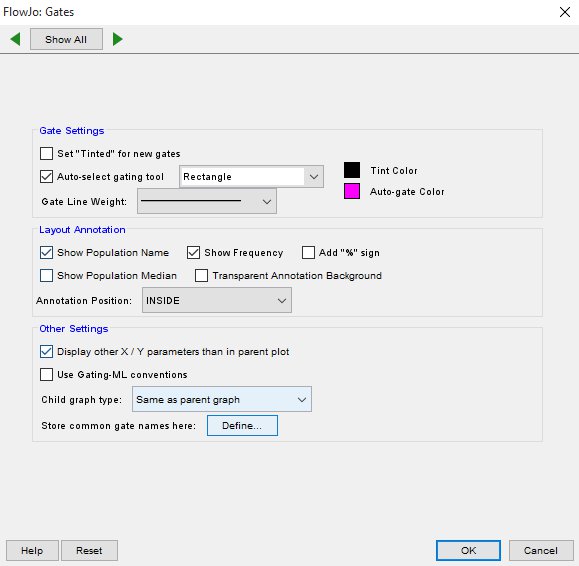
Once you open the preferences window, select Gates and you will see the window below.

Gate Settings:
The gate settings determine the default appearance of gates in graphs. You can set gates to tinted, change gate color, and change the gate line weight. You can also select your default gating tool.
Annotation:
The Annotation settings determine if and how certain gate statistics are displayed. You can choose to display population frequency, population name, population median, and also transparent annotation background. You can also choose the position where these are displayed.
Other Settings:
Display other parameters then in gating plot: If checked, a newly created subset’s graph will have different X and Y parameters (if possible).
Use Gating-ML conventions:
Check this box to save a second file besides the workspace file that describes the gates in the workspace using this industry standard format.
Show Child graph:
This allows you to select what parameters FlowJo will use on the axes when you open the graph of a sub-population. This menu allows you to choose whether to display the default parameters you set in Graph Preferences, or match the parameters of the parent graph.
Store common gate names here:
This is where you can add and save gate names that you use frequently.
