Quickly generate graphical reports of all your plots, histograms, plates, and overlays, in a variety of output formats. FlowJo v10 has added features to enhance your graphical output, check your gating strategy, and apply common formats to multiple objects!
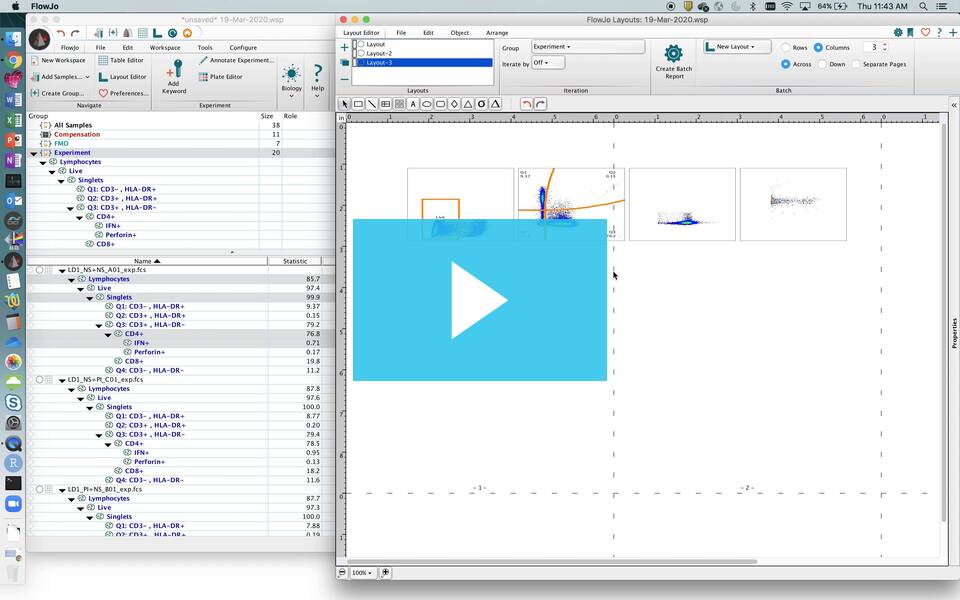
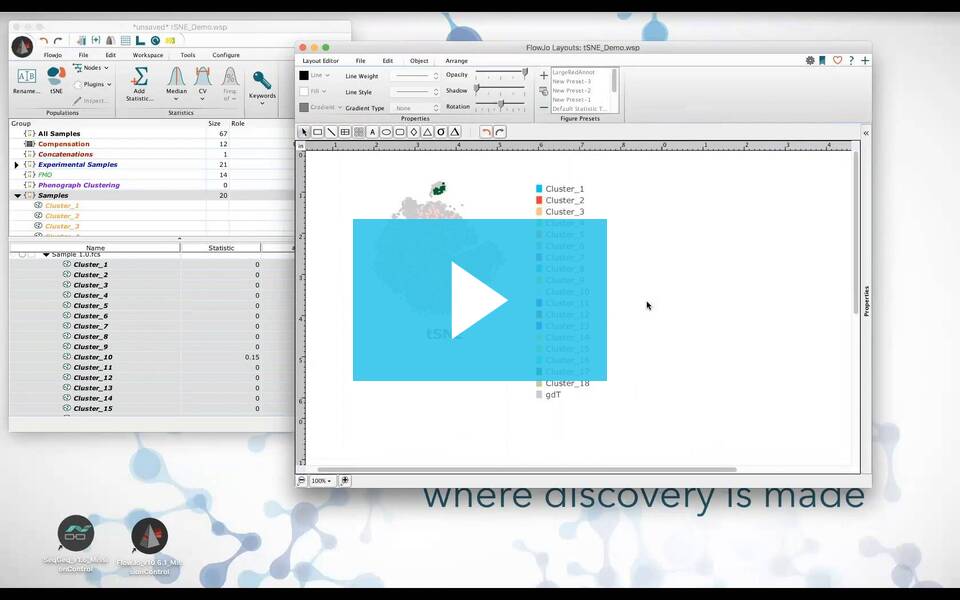
The Layout Editor is FlowJo’s tool for creating graphical reports. Like other areas of the program, batch operations are at the heart of the Layout Editor. In the Layout Editor you can create a single layout report or apply a layout strategy to an entire sample set.
Example of creating batched layout
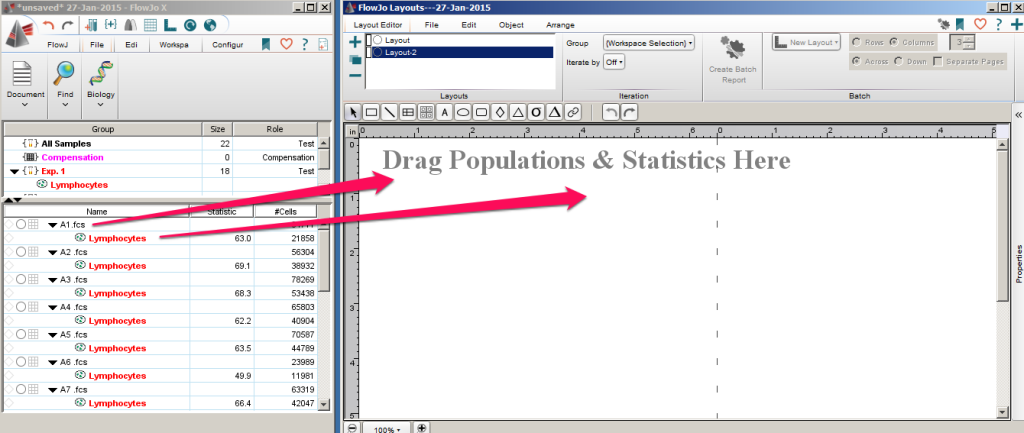
A simple graphical report can be produced by simply dragging populations from the Workspace into the layout editor. In the example illustrated below, the FCS file A1.fcs was added to a Workspace and a basic rectangular gate was created using the rectangle tool in the Graph Window. The gate was copied to all samples within the Workspace by dragging the new population “Lymphocytes to the “All Samples” group.
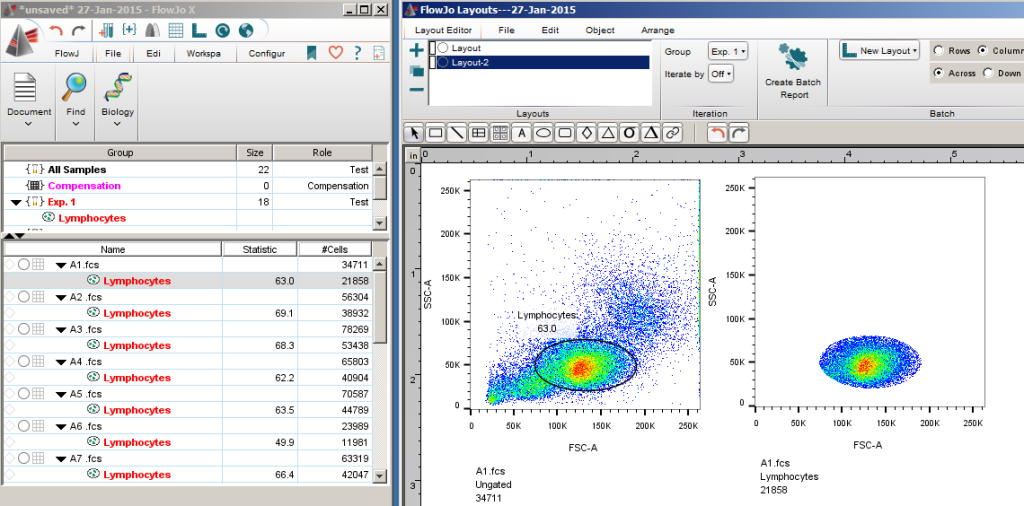
The Layout Editor is opened by clicking on the  icon at the top toolbar. The “Lymphocytes” population can be added to the initial blank Layout Editor by dragging the Lymphocyte population into the blank space in the Layout Editor. The top level population can be added to the layout the same way.


By default, FlowJo graphs the data using the set of parameters and graph style last used when viewing the data in the workspace. To make any changes to the graph, simply double click on it and uses the graph definition window that appears to make changes.
The work produced thus far is considered a Tile, a graphical piece that will serve as a template for the rest of the files, and be reproduced for each file by substituting in the data from those files when batching. To batch this report across all of your samples open up the Batch band from the Layout Editor ribbon. The band gives you the choice of the output formats, whether to put the graphics in rows or columns, set the number of rows or columns, and choose whether the plots should be filled in going across or going down. Make your selections and click the orange Create Batch Button.
Output Formats
FlowJo gives you the choice of batching to:
- A new layout – creates a new layout page within this workspace. This page will be interactive; the plots can be rearranged, the data can be accessed from these plots and the gates modified, and the plots will update live. Warning: this type of batch is memory intensive, as every plot must be created and then refreshed with all modifications. It will slow down the overall performance of your workspace. Consider using one of the other outputs to view and save reports. The original layout containing the graphs from one file will be saved in the workspace and provide an easy way to generate these reports again in the future.
- The printer – this is the best way to create a printed copy of your layouts or a PDF with multiple files per page. Batching to the printer automatically aligns all of the plots and fits them to a printed page.
- A Web Page – creates a web page called index.html that includes all plots, as well as a folder of graphics files for each FCS file.
- A Web Animation – creates a folder with graphics files and an animated html page that automatically opens and plays within the default browser.
- Power Point – creates a new power point file with one tile per slide.
- PDF – creates a new PDF document with one tile per page
You can also click the  icon at the top right of the Layout Editor as a shortcut to execute the default batch.
There are many tools available in the Layout Editor to assist you in creating a report and there are a variety of output options from which to choose. To learn about the controls, processes or tools in the Layout Editor, please select from the options below.
Menus and Dialogs
Layout Creation, Organization and Batch Operations
Resizing page vs. resizing plots
Batching Overlays and Locking Control Samples
Report and Image Export Options
Tools
More Layout Editor links are below:
Statistics, Tables and Equations
Tags: FlowJo


