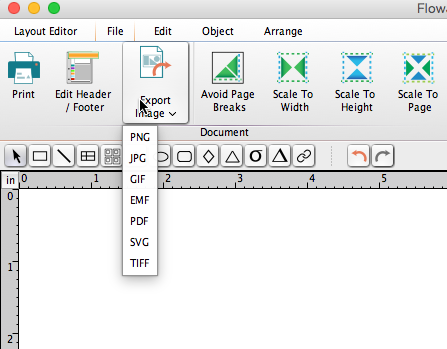
FlowJo gives you the most flexibility possible with exported graphics. You can easily ungroup any graphic, and change the font attributes, line styles, etc., to make any graph look exactly the way you want in the Layout Editor.

Hints on exporting graphs
- In the layout editor, you can copy/paste graphs
- to clipboard (copy/paste)

- to clipboard (copy/paste)
- to file (save or batch-to-file)

- File Tab -> Exportx As Image….. pdf, svg, emf, png, jpg and gif.

Exporting plots and batch reports – Send whole layouts to half a dozen file formats. Send a batch operation directly to a presentation, a PDF, even a web-ready slideshow!
Copy/paste images for use in other programs – If you only want to export some layout elements, FlowJo lets you use common file formats in simple copy-paste actions.
Batch analysis: The greatest strength of FlowJo is its ability to generate a batch analysis with a simple and flexible structure. Our approach lies in the grouping structure within the workspace.
Create an example layout, and with a single button, produce a batch layout wherein each sample or group of samples is analyzed and displayed identically to your example. The new layout can be displayed within FlowJo, or converted into a Web page, Powerpoint slide, an instant printout, appended to an Excel file, or saved as an HTML movie. See Layout Editor exports for more information.
Resize the page, not the graph: Many new users spend a lot of time individually resizing graphs to fit the desired number on a page. If you want the graphs to be the same size relative to each other, leave them at their default size, but drag the page breaks or use Scale To Page, Scale To Height, or Scale To Width commands from the Arrange Tab.

If you want graphs to have different sizes relative to each other, select all of the ones to resize, double click one and set its scaling in the Graph Definition window. When you apply the changes, all of the selected graphs will resize uniformly.
Tags: FlowJo