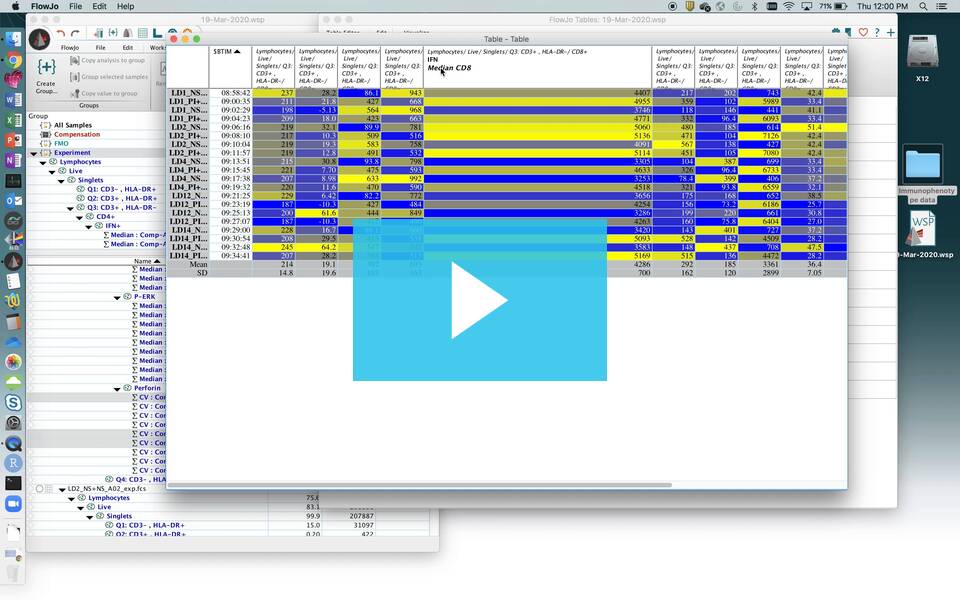
The Table Editor is FlowJo’s platform for exporting your analyses’ numerical attributes.
Tables can be used to show summary statistics, sample keywords, or custom formulas. They can be generated for viewing within FlowJo, or exported to many formats and manipulated outside of FlowJo.
FlowJo’s tables can be batched, similarly to layouts, including the use of iteration.
*Please note: when you batch your statistics to the group in the workspace, you only need to drag prototypic statistics from the FIRST sample into the Table Editor. When the table is created, it will batch automatically for all samples in that group.
Each column in FlowJo’s tables can be independently adjusted to include special formatting options (heat mapping), setting a control value (won’t iterate), or hidden (calculate but don’t show – useful for equations of equations when you don’t want to show the primary equation).
Please navigate through the pages below to dive into more specific details of the Table Editor.
- Setting up your table columns
- Batching/Iterating within the Table Editor
- Generating correlation, time series, and line plots from tables
- Setting up table preferences
An example of the Table Editor’s output (with statistics, a keyword, and an equation) is shown below:

For more information about the Table Editor, see the following pages:
Heat Maps & Conditional Formatting
Statistics in the Table Editor
Time Series Plots in the Table Editor
Defining Column Formatting in the Table Editor
Tags: FlowJo

