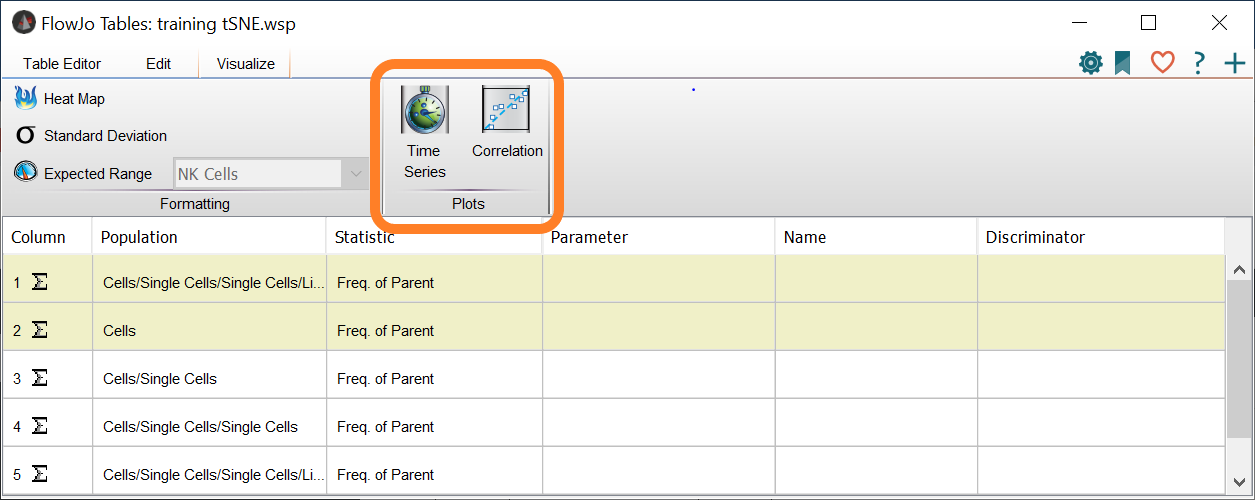
FlowJo’s Table Editor supports the alternate display of tabular information via plots. Available plots include Time Series, and Correlation.
Access plots via the Plots band within the Visualize tab in the Table Editor’s ribbon:
Time Series Plots
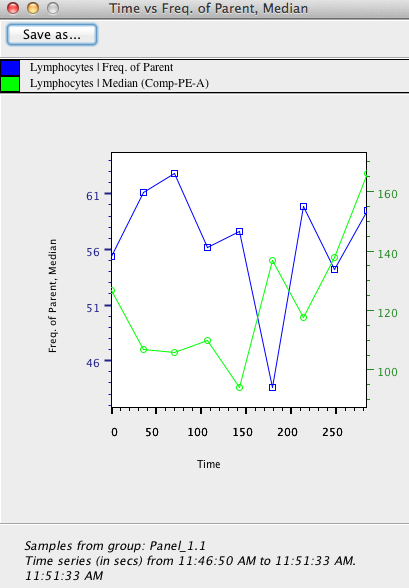
Time series plots require the input of one or more columns: select one or more of your table’s columns, then click the Time Series button. It returns a 1D plot of your selected column(s) vs. the range of time points constructed from the data selection in the current group.
Correlation Plots
Correlation plots require the input of two columns — select them, then click the Correlation button. A 2D correlation of your two parameters will be displayed. Axis labels can be long sometimes, so we suggest using custom names when creating correlation plots.


