Get your statistics, keywords, and formulas into the Table Editor for processing!
There are three types of columns you can create when you click the “Add Column” button in the Table Editor: Statistic, Keyword, and Formula columns. In each case you can name the column, define it as a control value, choose whether or not to display its values in the finished table, and format the output according to criteria of your choice.
Most users use the Table Editor, the numerical reporting batch tool in FlowJo, for simply batching and exporting statistics. The easiest way to add statistics to the Table Editor is to simply drag and drop the statistic node from the workspace into the Table Editor:

However, if you’d like to add keywords or create equations, navigate to the Edit tab and click the “Add Column” function within the Columns band:

Clicking this button opens a user interface called the Column Information dialog. This dialog helps you style and define the output columns in your final table.
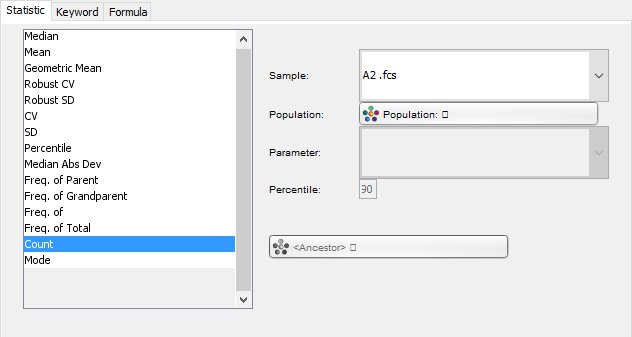
To add a statistic column, choose the Statistic tab; select the type of statistic to add, choose a desired sample, which population, and optionally select the desired parameter and/or percentile.

Pro Tip: this step is easier by simply dragging in a statistic from the workspace window (as noted above).
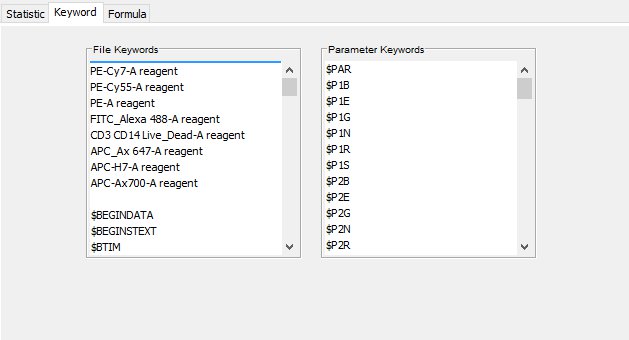
To add a keyword column, switch to the Keyword tab and select which keywords you’d like to show.

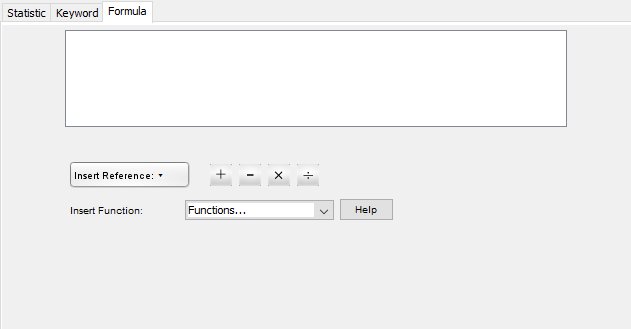
You can also add formulas. These combine other columns from your table in mathematical or logical expressions. Formulas are described in more detail here.

For more information about the Table Editor, please see:
Heat Maps & Conditional Formatting
Statistics in the Table Editor
Time Series Plots in the Table Editor
Defining Column Formatting in the Table Editor
Tags: FlowJo