In FlowJo, batch analysis takes advantage of your computer’s processing power and follows an analysis template to analyze multiple sets of data. Similarly to batching gates in the workspace and batching plots in the Layout Editor, the Table Editor is setup for batching numbers such as summary statistics (mean, median, CV, etc.), gate frequencies, values of keywords, and formulas.
Naming Tables
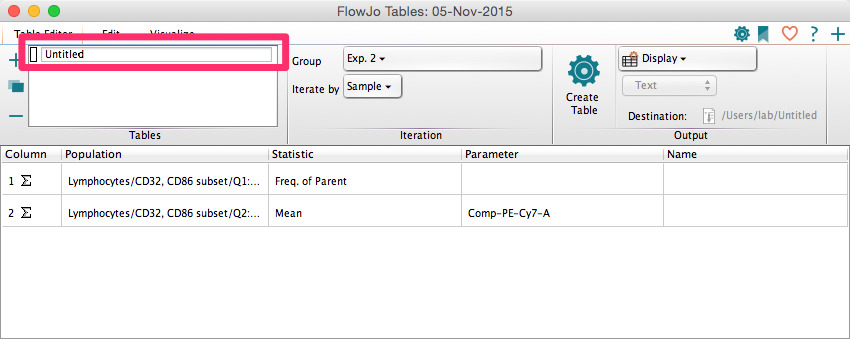
Tables can have custom names in FlowJo. Custom-named tables will help you organize what tables contain what statistical information you are gathering. To give a table a custom name, simply double-click the default name “Untitled” in the upper left hand corner of the Tables band, type in the new name, and press enter.

The general workflow of batching tables is to:
- Define columns
- Set iteration
- Set output type
- Commit settings to a template
- Generate the batch
Each of these steps are described in detail below.
1. Define columns
In this step, we define our output’s columns. Rows in the output table are always going to be samples, or populations, from your current workspace selection. Columns in the output table can be defined by dragging in nodes from the Workspace window, or you can add them manually via the Column Information dialog.
a. Drag in nodes from the workspace window:
- Dragging in a gate creates a “frequency of parent” column.
- Dragging in a stat-node (median, count, CV, etc.) will report that statistic’s value.
- Dragging in a platform node (Cell Cycle, etc.) will explode that node into all of its summary statistics and place those each in their own column (Pro Tip: you may want to select some and remove them. Not all are interesting ? ).
b. Within the Edit Tab, click the “Add Column” button in the Columns band. This opens the Column Information dialog.
- To add a “stat” column, choose the Statistic tab, and choose the appropriate sample, population, and optionally a parameter/percentile.
- To add a keyword column, switch to the Keyword tab and select which keywords you’d like to display.
- You can also add formulas. These combine other columns from your table in mathematical or logical expressions.
2. Set iteration
By default, iteration is set to report the columns defined in the table for every sample in the currently selected workspace group. However, fancier iteration methods can be used here, similarly to the Layout Editor. For example, if you wish to develop a template, you may want to select a specific group and change the iteration type to iterate by a panel or keyword.
Fig 1. Iteration options (Group, Iterate by) in the Table Editor.
a. Example 1: Simple batch (Iterate by sample)
In the case of a simple batch, you probably just want your selection of columns to be batched down the list of samples in your current workspace group. To achieve this:
- In the Table Editor, select the group for which you wish to generate statistics. This will default on the group currently selected in the workspace
- Leave ‘Iterate by’ set to ‘Sample’
- Choose an output destination
- Click the Display button to show the table in FlowJo with live recalculations
b. Example 2: Panel batch (Iterate by panel)
Iterating by panel is essentially identical to iterating by sample, but it iterates over every N samples instead of every 1 sample. Consider a hypothetical panel with 4 tubes:
- B cell tube surface markers
- T cell tube surface markers
- B cell cytokine tube
- T cell cytokine tube

You may wish to define a table which reports one column from each tube. This creates a much more compact view of the data. Example follows:
1. Make a new table, set ‘Iterate by’ to ‘Panel’, and set your panel size to 4. Do this before you drag in anything.

2. Drag in your Count statistics from the workspace — one from each tube in your panel. Notice the Discriminator column shows their relative ordering. Pro Tip: this type of batching is sensitive to sort order in the workspace.
3. Hit the batch (display) button: 

c. Example 3: Keyword batch (Iterate by keyword)
Many times you will want to generate statistics for a group of samples in a panel, where each of the files are gated or displayed differently — thus complicating the setup. For this task, it’s best to iterate by keywords. In our example, we have a set of 4 patient samples, each stained in a panel of 4 tubes. We’d like to batch statistics from specific samples within the panel for each tube in the panel, then batch that for the group.

To set this up, begin with an empty new table set to iterate by two keywords:
1) Iterator – what bunches up the tubes that belong to one patient, i.e., have the same value for each patient? I used “FlowJoDemoFileID” which here corresponds to patient ID.
2) Discriminator – within a “patient” group, how can we tell the different tubes of the panel apart? I used FlowJo’s keyword for Tube ID.
3. Set output type
There are several different destinations to choose from for statistical outputs. To learn more about the different output destinations, click here.
4. Commit settings to a template
To learn more about creating templates, click here.
5. Generate the batch
Upon clicking the display button, the table will be shown in FlowJo with live recalculations.

For more information about the Table Editor, please see:
Heat Maps & Conditional Formatting
Statistics in the Table Editor
Time Series Plots in the Table Editor
Defining Column Formatting in the Table Editor
Tags: FlowJo