A tool for making the creation of complex scaling rules both easy and automated.
New to version 10.10 is the Advanced Rules tool within the Cytometer Preferences that allows a user to define rules for parameter scaling that are far more in-depth than previously allowed.
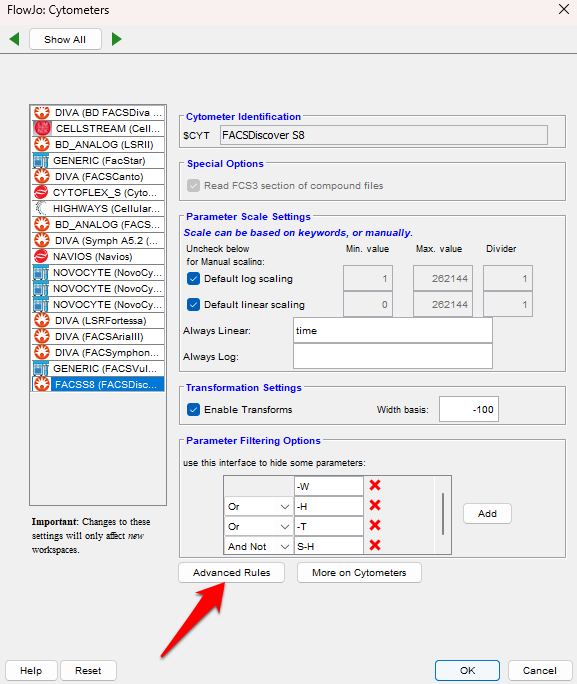
To create advanced rules, select the cytometer for which you would like to define a rule, and click the Advanced Rules button at the bottom of the preferences. A window will appear lacking rules. To start, click the Add Rule button, annotated with a 1 in the picture below.
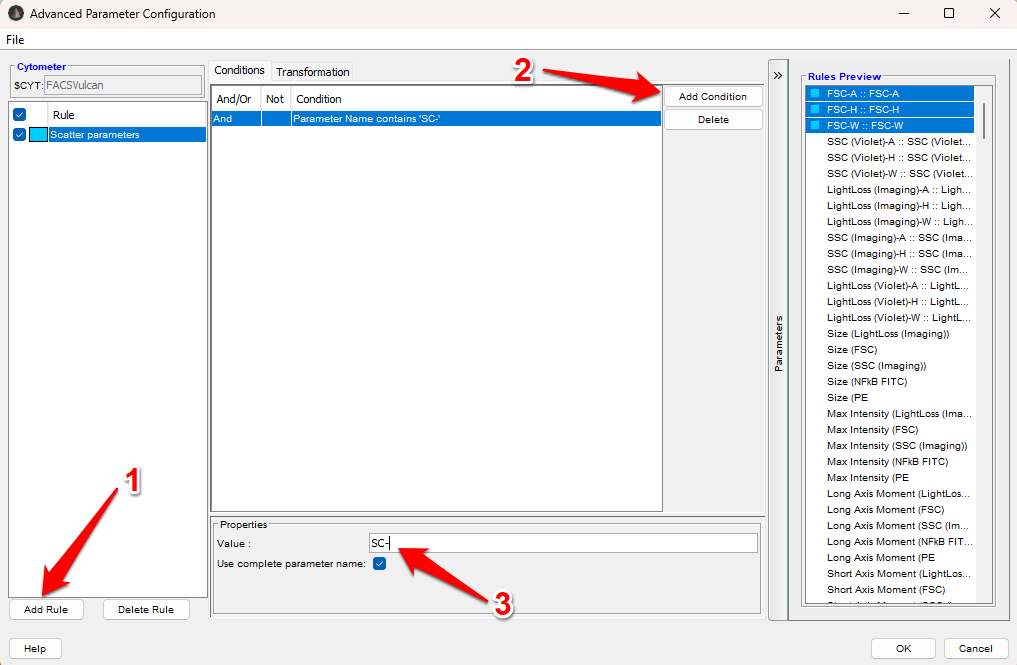
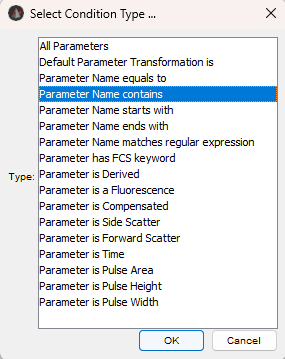
Give the rule a name that will mean something to you. Next, add a condition to define which parameters this rule will apply to by clicking the Add Condition button, annotated in the figure above with a 2. The window shown below will appear with a variety of conditional statements. Pick the one that suits your requirements. In this example, ‘Parameter Name contains’ has been selected. For a choice that requires some additional definition, such as this one does, you will need to type the value into the box annotated in the figure above with a 3. In this example, SC- has been entered. The parameters that match this condition will highlight on the right and you will see a colored box matching the Rule that will be used to scale this parameter.
Once the parameter(s) of interest have been selected, click the transform button to display the data from the selected file in the FlowJo workspace and the first parameter that matches the rules you have created. Clicking on a specific parameter will cause that parameter to be displayed on the plot.
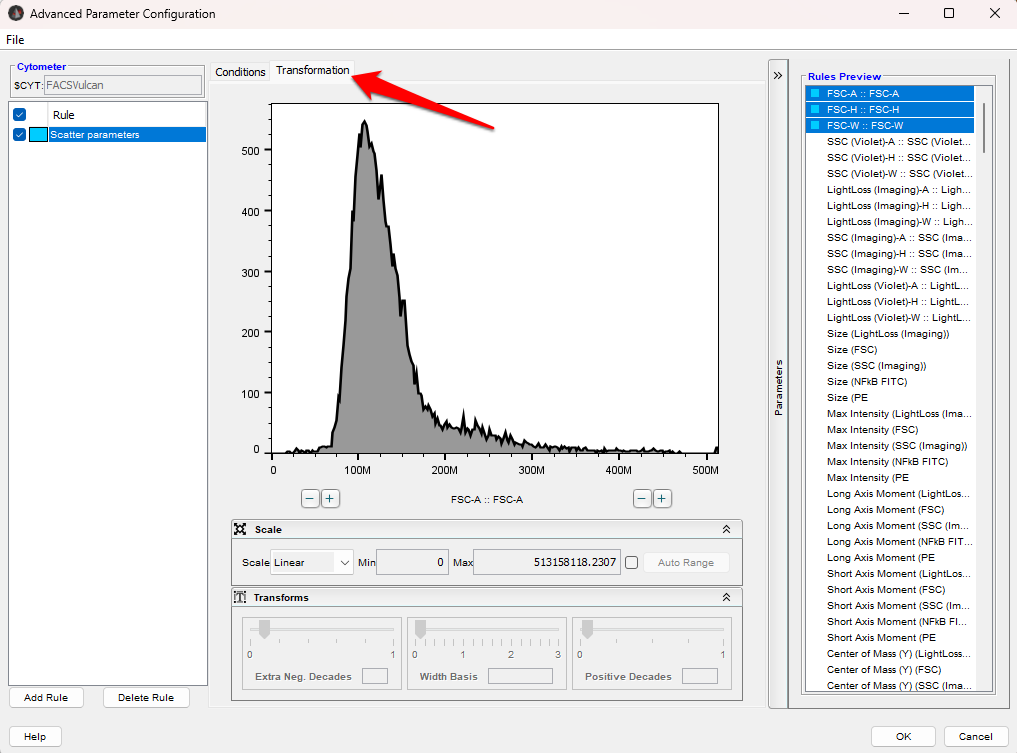
Notice that the controls provided are the same controls that are available within the T-button that exists on all graph windows in FlowJo. Use these controls as you normally would to get the data on scale. When you are pleased with the scaling of the data, click either Add Rule to create another custom scale preference for this cytometer, or OK to exit the window and save the changes you have made.
Preferences apply to newly opened workspaces. Existing workspace retain the preferences they were created with.
You can create as many rules as needed. The rule being used to scale the parameter will be highlighted by color in the list to the right of the plot.
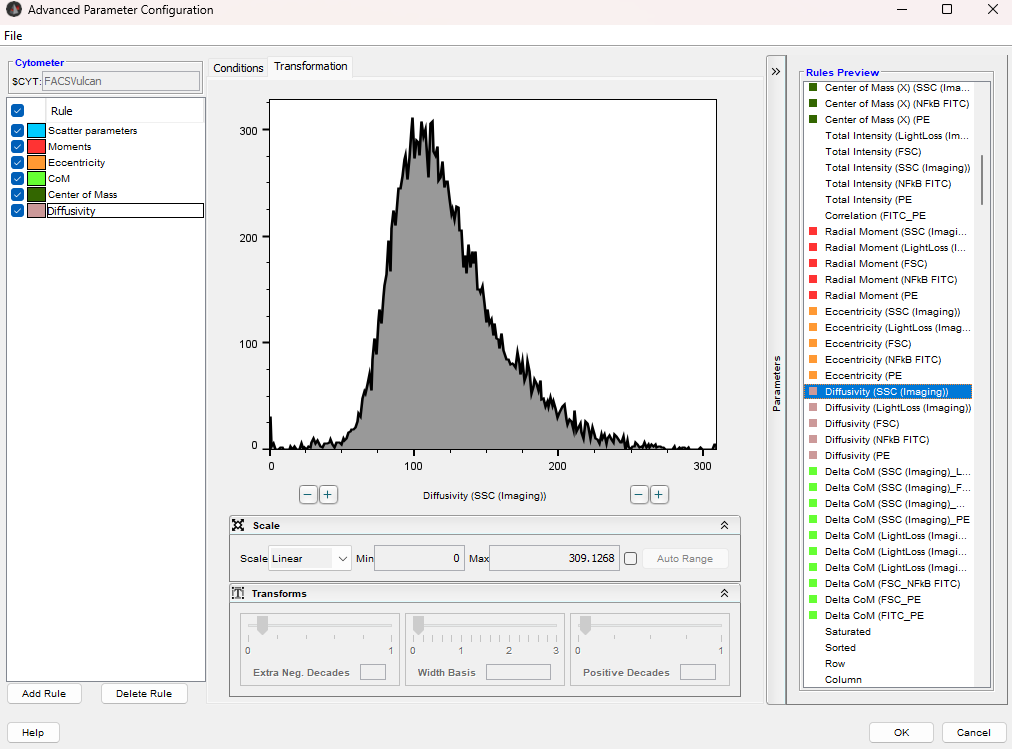
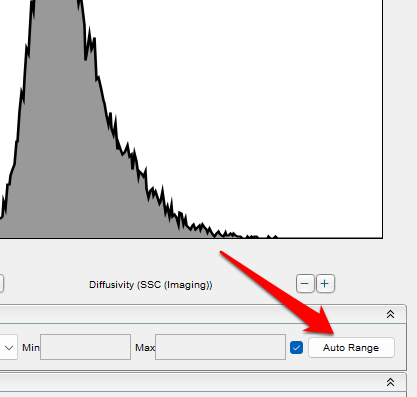
Finally, there is an Auto Range option available for all parameters. If you check the Auto Range box you will notice that the scale disappears within the preview, as no specific bounds are being set. Auto Range will use the parameter from the first file it finds in the workspace to estimate proper ranges that minimize white space, and transform settings as appropriate to scale the data uniquely on a per workspace basis. This will work well for data that have a consistent range, and not well for those that vary greatly.
