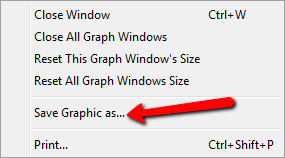
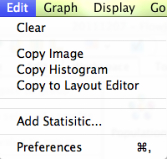
You can copy and paste any graph from FlowJo into another software program. Simply select Copy Image from the Edit menu when the graph window is foremost on your screen. Switch to the other application, and select Edit > Paste or (control-V PC or Cmd-V Mac). The graphs are exported as bitmaps. Bitmaps are most quickly drawn by other programs and the representation is quite good. However, bitmaps cannot be resized without risking significant distortion to things like axis labels, text, etc. If you want to export high-quality vector art go to File menu and choose Save Graphic As.

This will save the image as a PNG. The plot itself will remain fixed at screen resolution, i.e. you won’t be able get better resolution than what you see in FlowJo for univariate or bivariate plots, but lines, text, etc. will scale.
Below is the Edit menu in the Graph Window.

Other copy options include:
Copy Histogram will copy scale values and channel values to the clipboard. Scale values are calculated from the raw cytometry data. Similar values are collected into bins, making calculations faster and allow for better interpretation. Channel numbers are the raw values sent from the cytometer for each event. You might wish to export the text version of a histogram so that you can perform specialized analyses, such as DNA analysis (cell-cycle fitting), etc. When you paste into a spreadsheet, two columns will be created. The first one has the scale or channel numbers for the histogram (at whatever resolution the data was collected); the second has the event counts for each channel. If a gate was applied to view the graph, then the exported data will reflect only the gated events.
Copy to Layout Editor will copy the graph image to the Layout Editor and place the plot and its associated annotation on the layout canvas.
For more information, see the Web page about exporting raw data and the section on the kinetics platform.
Tags: FlowJo
