Getting the good stuff inside FlowJo out for other uses!
FlowJo makes exporting your analyses quick and easy. From almost every interface of the program there is a way to get your sample data, plots, or statistics out of FlowJo for use in spreadsheets, graphics programs, or almost any secondary software package. The interface areas of FlowJo that have export options are listed below, along with their relevant export formats. Click on the links below for more detailed information about export options for each area. The default format for many areas’ export actions can be set in File Format Preferences.
Exporting from the Workspace
- Exporting new FCS files – Need to clean up data or reduce file size? Try exporting a subset of your data file into a fresh new FCS file and reimport into FlowJo.
- Just right click a file in the workspace and choose Export. You can export an entire file and select the number of events you want in the new file, or you can export a gated subset and get a new file with just the events in that gated region.
- Exporting your data in CSV – Want to crunch the raw numbers in a spreadsheet or statistical package? Try creating this text file format that is easily digested by the most finicky parsers.
- Go to Save As –> Excel (XLS).
- Exporting Workspace structure – Export your entire workspace without data to use as a template with another data set.
- Go to Save As –> Template (WSPT).
- This isn’t so much of an “exporting” feature, but will allow you to utilize the workspace for future experiments.
Exporting from the Layout Editor
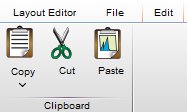
- In the Layout Editor, you can copy/paste graphs:
- To clipboard (copy/paste)
- To file (save or batch-to-file)

- File Tab –> Export Image –> .png, .jpg, .gif, .emf, .pdf, .svg, or .tiff.
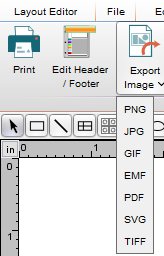
- Exporting plots and batch reports – Send whole layouts to half a dozen file formats. Send a batch operation directly to a presentation, a PDF, or even a web-ready slideshow!
- Copy/paste images for use in other programs – If you only want to export some layout elements, FlowJo lets you use common file formats in simple copy-paste actions.
Exporting from the Table Editor
- Exporting statistics and table information for use in other programs like Excel, Prism, or a database — If you make a steller table and need to show the world, export it in any format/file types or even loop it right back into the Layout Editor.

Exporting from the Graph Window
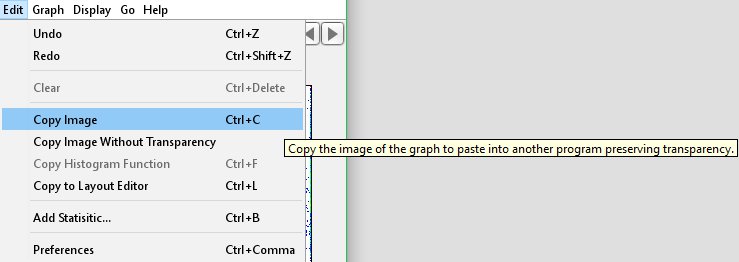
- Copy/paste plots for use in other programs – Want flexibility? There are four kinds of Copy Image functions under one Edit Menu! Just a quick Hot Key away, too!
- Copy the graph window to the clipboard with transparency.
- Copy a histogram as text – Great for quickly pasting the binned data into your spreadsheet of choice.
- As a note, FlowJo bins your data into 4096 channels, and then displays it in 256, so if you plot our binned data into your own histogram, there will be 4096 channels and the profile may look slightly different.
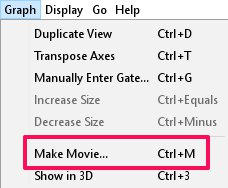
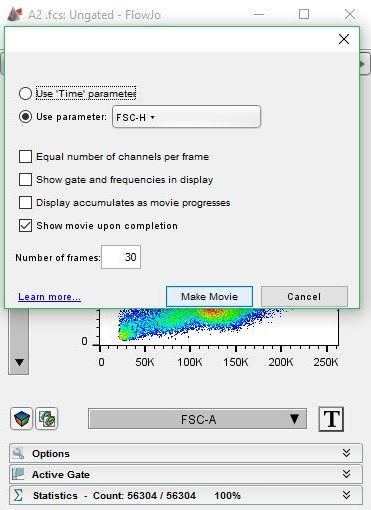
- Export a movie– What better way to show data in the multimedia age than a web-ready animation of your plot?
- Use the movie function to view parameters on a plot using a third parameter as the remote control.
Tags: FlowJo
