The Layout Editor in version 10 now allows you to create tables of statistics for a single sample’s entire hierarchy. How is this different from previous versions? Previous versions of FlowJo only allowed you to create tables with each sample as a row and the statistics, no matter at what population level in the hierarchy, always belonged to that sample in that row. Now in version 10, the new table format in the layout editor provides you with the ability to place populations from the same sample in different rows.
To create on of these tables in the Layout Editor, click the Statistic Table icon shown in the image below:

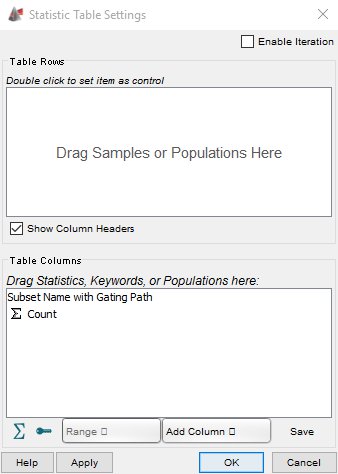
Drag your cursor onto a layout page and you will be provided with this interface:

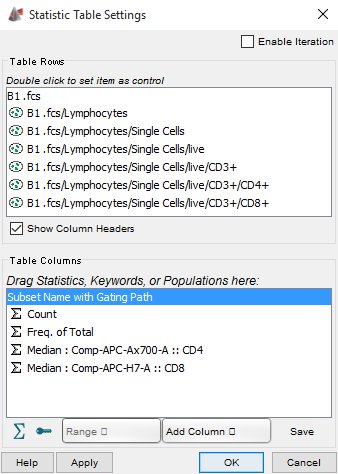
Drag any population you’d like included in the table into the top portion of the window and any statistic you’d like present into the bottom portion:

Once you have added the populations and statistics you would like in the table, click ‘OK’ and the table will be generated in the layout editor for the current sample:

Tags: FlowJo
