FlowJo provides a quick and easy way to add important Statistics to your analyses and reports.
Statistics are treated like other nodes in the Workspace. They can be added singly or en-masse to sub-populations, layouts and tables (via drag-and-drop or thru the Add Statistic dialog). A full list of statistics available for use can be found here, which includes definitions for such computations as median, mean, or frequency of a parent population etc…
Of note: statistics are recomputed whenever a gate is changed or upon the opening of a Workspace. Also, gate frequencies display automatically in the graph window upon gate creation (this can be turned on or off from the Display menu of the Graph Window).
Statistics can be applied in multiple areas of the program, namely:
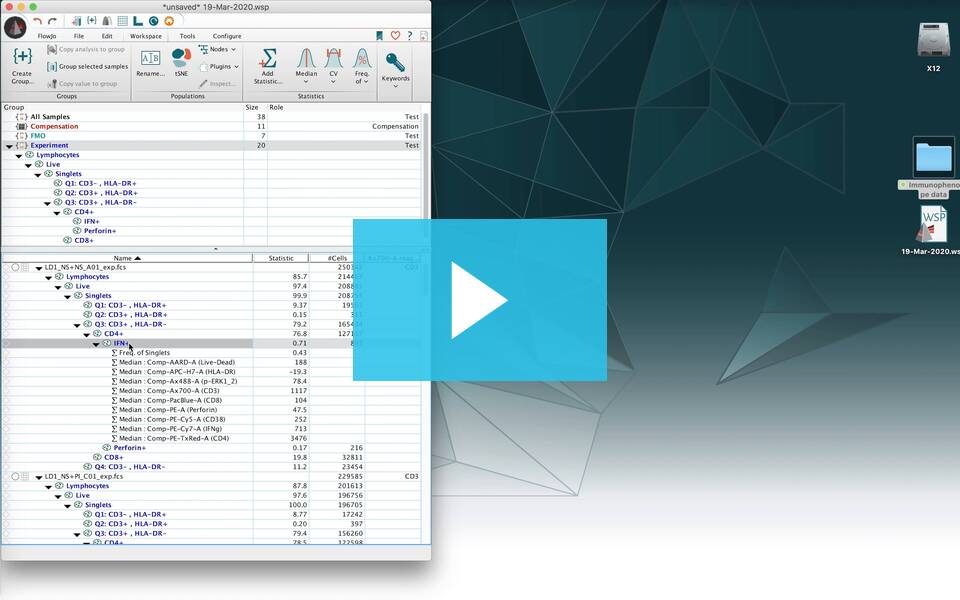
Selecting one or more populations and clicking on the desired statistic from the Statistics band in the workspace window will add statistics to the selected populations. The most commonly used statistics (Median, CV and Freq. of) are placed directly in the band. The full set of available statistics can be found by clicking on the Add Statistic button.

When viewing a population in a graph window (below) and clicking on the Statistic button, FlowJo brings up the Statistics Dialog window.
When you are preparing a tabular report, you can add a new statistic to appear as a column in your table by clicking on the Add Column button of the Columns band in the Table Editor. Statistics can be conveniently organized and exported by the table editor. Statistic nodes can be dragged to the table editor; when the table is computed, then all statistic nodes will be updated and computed.
Through the Legend tab of the Graph Definition Window in the Layout Editor. This will create a text box containing the statistic description and the value; it will be updated whenever the statistic is modified (i.e., it is “live”).
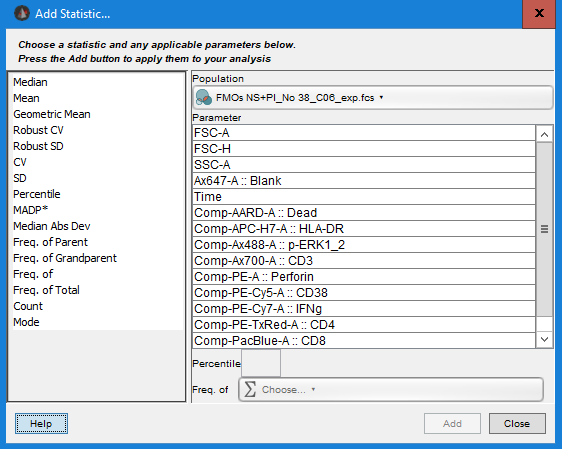
All methods will bring up this (or similar) dialog, where statistics can be chosen and added. In this dialog you choose a statistic and specify the parameters to use when applying it to a population node.

Related Links:
Statistics, Tables and Equations
Editing Statistics in the Layout
Statistics in the Table Editor
Please note: Statistics in FlowJo are calculated on binned data, thus changes to the transforms of a parameter will change the statistical values reported for that parameter. Typically this change will not be outside the thresholds of biological relevance.
Tags: FlowJo

