Data visualization is important in flow cytometry data analysis – transformation provides a method to visualize populations in a shape that’s easier to interpret by eye, because they resemble normal distributions.
Traditionally, without biexponential transformation, after background fluorescence subtraction and the introduction of compensation error, data points may have negative fluorescence. In a standard log scale, there is no zero and no negative, so data is ‘piled-up’ on the axis in the first channel. Fluorescent baseline subtraction error during acquisition is a fundamental of flow cytometry and the basic reason why negative fluorescence is observed (for more, click here). Further contributing to this phenomenon of ‘negative’ fluorescence is the contribution of compensation error or what is called ‘spreading’. As the list of parameters in modern flow cytometric experiments expands, more compensation error is introduced into the final results (see this paper by Dr. Mario Roederer, Cytometry 45:194–205 (2001)). Thus it has become imperative to transform the data in such a way so that the axis ‘pile-up’ can be observed. With the introduction of biexponential transformation, distributions around zero can now be observed.
Traditional logarithmic scaling compresses the channels of visual space as the scale increases. This is necessary due to the large dynamic range of most antibody conjugated fluorochromes. A log scale provides a nice ‘clustering’ effect in the upper ranges of the log scale and provides a clear data distribution. However, the log scale is inappropriate for data at the lower end of the log scale. This leads to visual misrepresentations of dispersed populations in the lower ranges of the logarithmic scale. This visual misrepresentation is quickly realized when one considers that 10 units of fluorescence in the range of 1-10 is observed in the same visual space as 10,000 fluorescent units in the range of 1000-10,000 when plotted on a logarithmic scale.
By applying a biexponential transform to the data, the scale is compressed in the lower range, typically from 1-10 or 1-100, leading to a more accurate visual representation of fluorescence units in the low range of the scale as compared to the higher range of the scale. Hence, using a biexponential transformation provides a more precise visualization tool when comparing populations with low fluorescence versus those with high fluorescence, as opposed to a standard log scale.
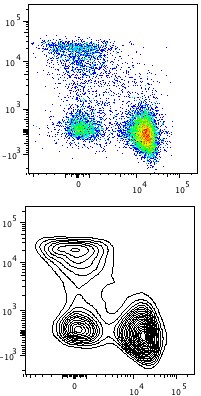
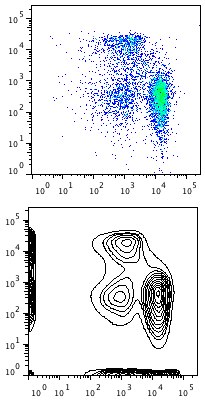
In the images below, data is shown before and after the application of the display transformation. Note the compression around the zero area and the representation of data lying in ‘negative’ space allows for more accurate representation of the event distribution.
Biexponential Transform Log Transform


If you would like a more detailed and in-depth look at data transformations, please refer to additional webpages for an overview of transforms and more details on procedures of biexponential transforms.
Additional resources are also provided in the papers below:
- Herzenberg LA, Tung J, Moore WA, Herzenberg LA, Parks DR. Interpreting flow cytometry data: a guide for the perplexed. Nat Immunol. 2006 Jul;7(7):681-5. (link)
- Parks DR, Roederer M, Moore WA. A new “Logicle” display method avoids deceptive effects of logarithmic scaling for low signals and compensated data. Cytometry A. 2006 Jun;69(6):541-51. (link)
See Also:
Display Transformation and Digital Data
