Biexponential scaling helps visualize data that is compressed against the low x- and y- axes. “Squished” data is easily viewed by adding a section of linear scale to log acquired data.
Alternate display transformations are intended to provide a more intuitive view of flow cytometry data. Specifically, they address the problem of how to visualize high dynamic range data that contains both negative and positive values. For a more general overview on transforms, go here. For an explanation on benefits, go here.
The method used to address this challenge in FlowJo is called biexponential transformation. It’s primary purpose is to provide display settings that are, in effect, a hybridization of linear and log scaling technique. For low magnitude values (around 0), the scaling is displayed as if it were linear. For large values, this biexponential function displays the data with more log-like properties. The benefit of this approach is that distributions with small magnitude values and negative values can be shown alongside large magnitude, and large variance distributions.
Quick Aside: FCS2 and FCS3 files
The mechanics for adjusting a biexponential transformation depend somewhat on which type of FCS files are being analyzed. Please pay attention to the appropriate guidelines depending on which type of file you are using.
FCS2 data files
If FCS2.0 data was acquired on an analog instrument, the log converted in the machine will transform the data into log, so using a biexponential transform after acquisition will not work properly. These types of data are only useful if the file has been acquired in linear and compensated post acquisition in FlowJo. This is because these data files have typically been compensated and log transformed before the file was written, thereby eliminating the information in the file that makes the biexponential transformation process interesting or useful. To determine how to create a compensation matrix in FlowJo click here or download the Compensation Tutorial.
If post acquisition compensation has been applied to the file, display transformations in FlowJo can be enabled using the T-button and selecting “Customize Axis…”. From this menu, you will be able to select a scaling type. For more on the “T” Button options, click here. For complete instructions on how to optimize transform settings in FlowJo, please see below.

FCS3 data files
As FCS3.0 data files are neither compensated, nor transformed, before being written, there is much improved flexibility with regards to how these files can be displayed. Scaling preferences, including default transformation settings, can be found found in the Cytometers tab of the preferences panel. These transformation settings can be specified on a per cytometer basis and can be subsequently refined using the T Button as described in the next section.
Optimizing histogram displays with a biexponential transformation
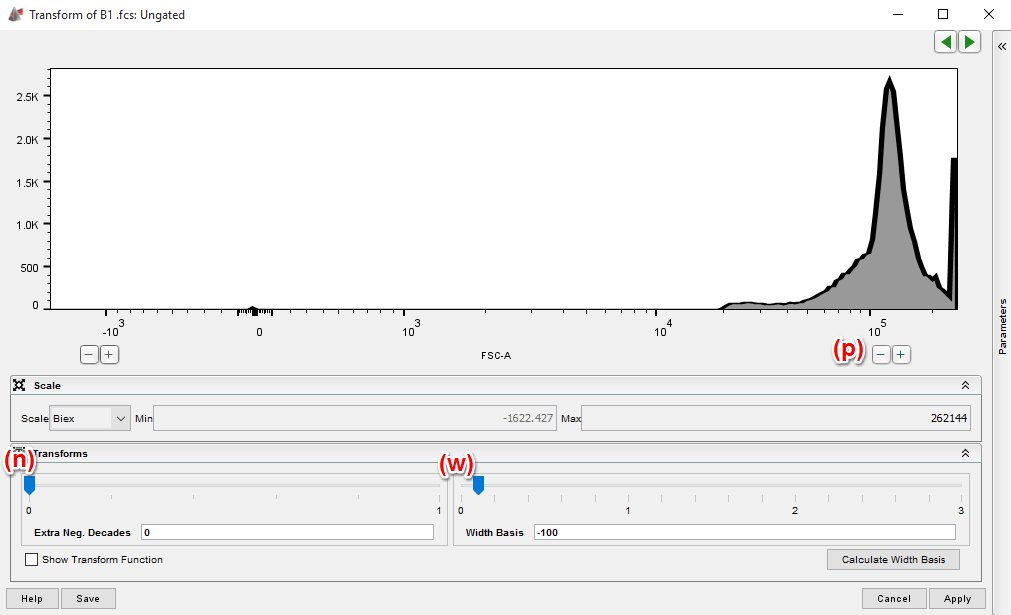
Biexponential scaling has options for customization and these settings are very influential to the success of this process. There are 3 settings for each parameter in your data file that will need to be set in order to achieve an optimum histogram, these are; negative decades (n), positive decades (p) and width basis (w).
Fortunately, the complexity of this process can be reduced by focusing on the width (w) parameter. In order to determine the appropriate value for w, simply open up a graph window for a fully stained population that is representative of your experimental files, and adjust w to show the histogram as described below for each of your parameters.

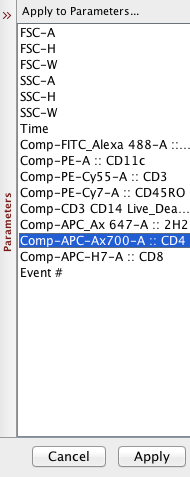
On the right hand side of the window, there is a parameter list. It is likely that you only want to change the scaling on one parameter, so BE SURE to select the parameter you want BEFORE hitting Apply.

Adjusting width (w):
The value for w will determine the amount of channels to be compressed into linear space around zero. The space of linear does not change, but rather the number of channels or bins being compressed into the linear space.
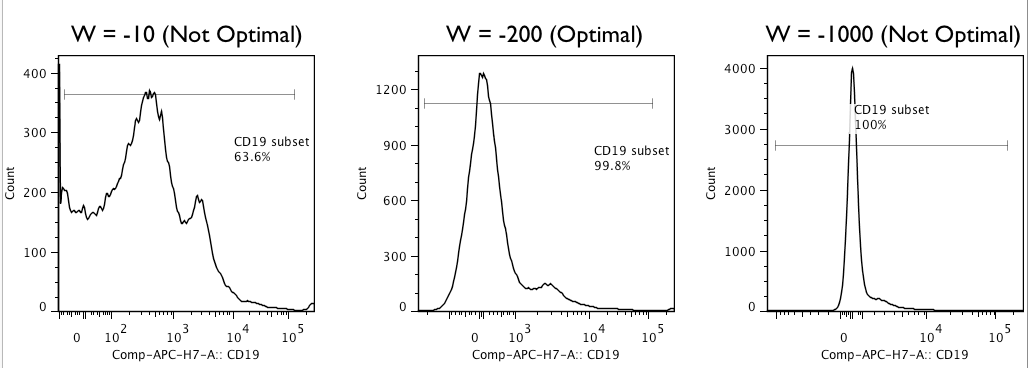
Width should be set high enough that all of the data in the histogram is visible on screen, but not so high that extra white space is seen to the left hand side of your dimmest distribution (figure).

For most practical uses, once all events have been shifted off the axis and there is no more axis ‘pile-up’, then the optimal width basis value has been reached.
When only adjusting width (w) may not be sufficient
Another component in the biexponential transform calculation is the negative decades or negative space. This is the only other value you will probably ever need to adjust. In cases where a high width basis may start compressing dim events into the negative cluster, you may want to lower the width basis (less compression around zero) and instead, increase the negative space by 0.5 – 1.0. Doing this will expand the space around zero so the dim events are still visible, but also expand the negative space to remove the cells from the axis and allow you to see the full distribution.
Positive decades
The presence of the positive decade adjustment is due to the algorithm used for logicle transformation, but is not useful in 99.9% of the cases that require adjusting the biexponential transform. It may be appropriate to adjust this value only if you use data that displays data with a data range greater than 5 decades (Gallios, Attune, Accuri, Astrios).
See Also:
Display Transformation and Digital Data
