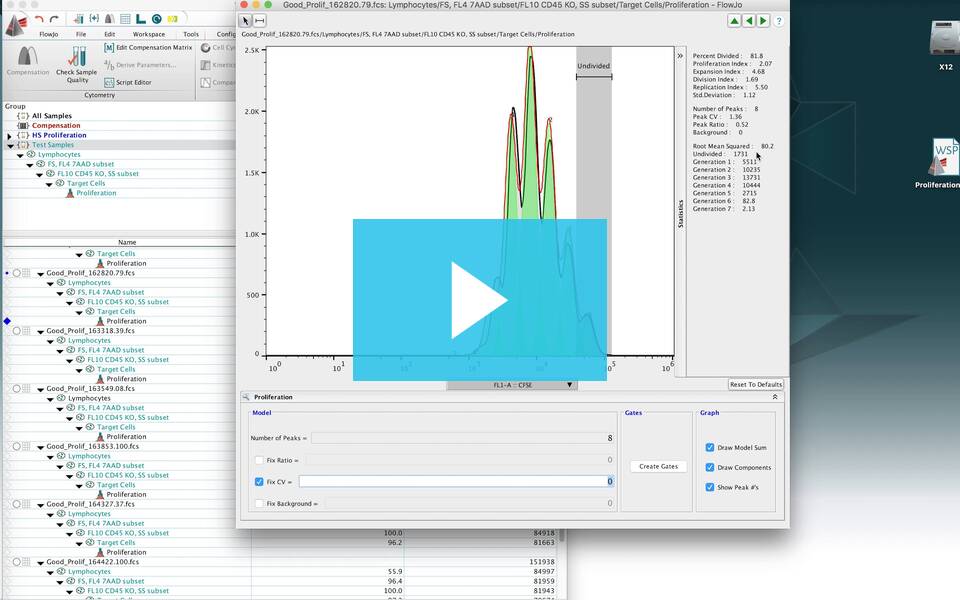
FlowJo’s Proliferation platform allows users to quantify many different common types of proliferation assays which look at cell division over time.
FlowJo’s Proliferation tool looks for a pattern typically expressed by cells loaded with fluorescent dye and allowed to divide. Typically this tool is used to model the sample as it undergoes 3-6 divisions and generate related statistics. FlowJo University has a great webinar that demonstrates how to use the proliferation tool. A common probe for this assay is CFSE, but several others are also.
Using the Proliferation Tool
The Proliferation Platform can be found with other platforms under “Biology” in the “FlowJo” tab. It is a good idea to do some initial clean up gating (size, live/dead, singlets, etc.) to isolate a population to preform proliferation analysis on.
![]()
Usually, proliferation assays will begin analysis using an unstimulated sample to determine the “Generation 0” peak. The generation 0 peak represents the undivided cells and should have a relatively consistent intensity and CV across the samples collected in the proliferation assay. The “Generation 0” peak can be set by drawing a gate around the unstimulated peak in the proliferation assay.
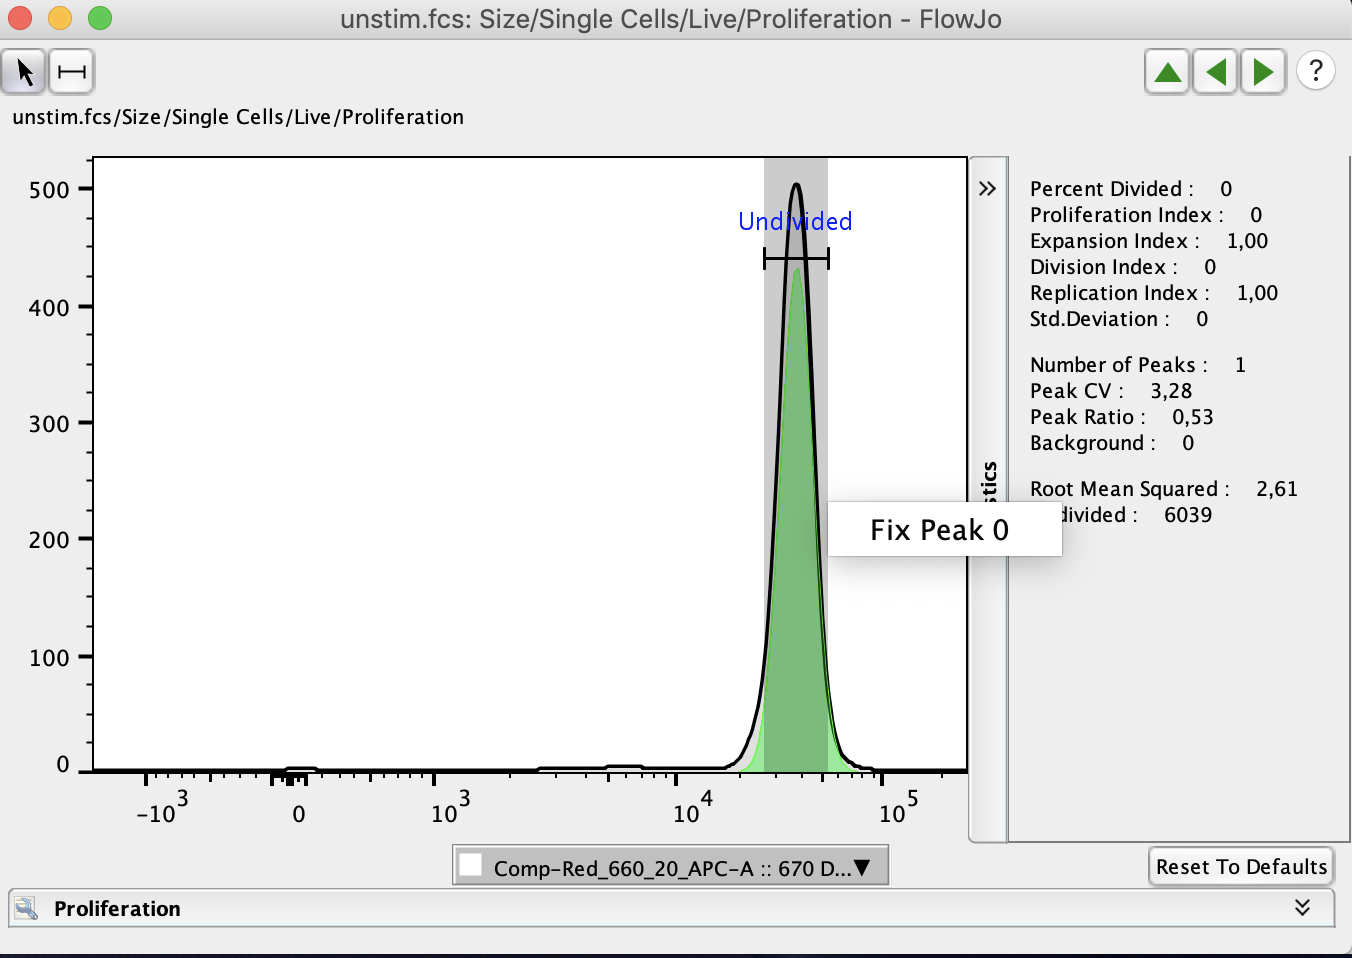
When proliferation is first selected it will create a node in the workspace under the population proliferation is being preformed on. This node can be double clicked to open the proliferation window, or drag and dropped onto populations or groups to apply the proliferation analysis to other samples.

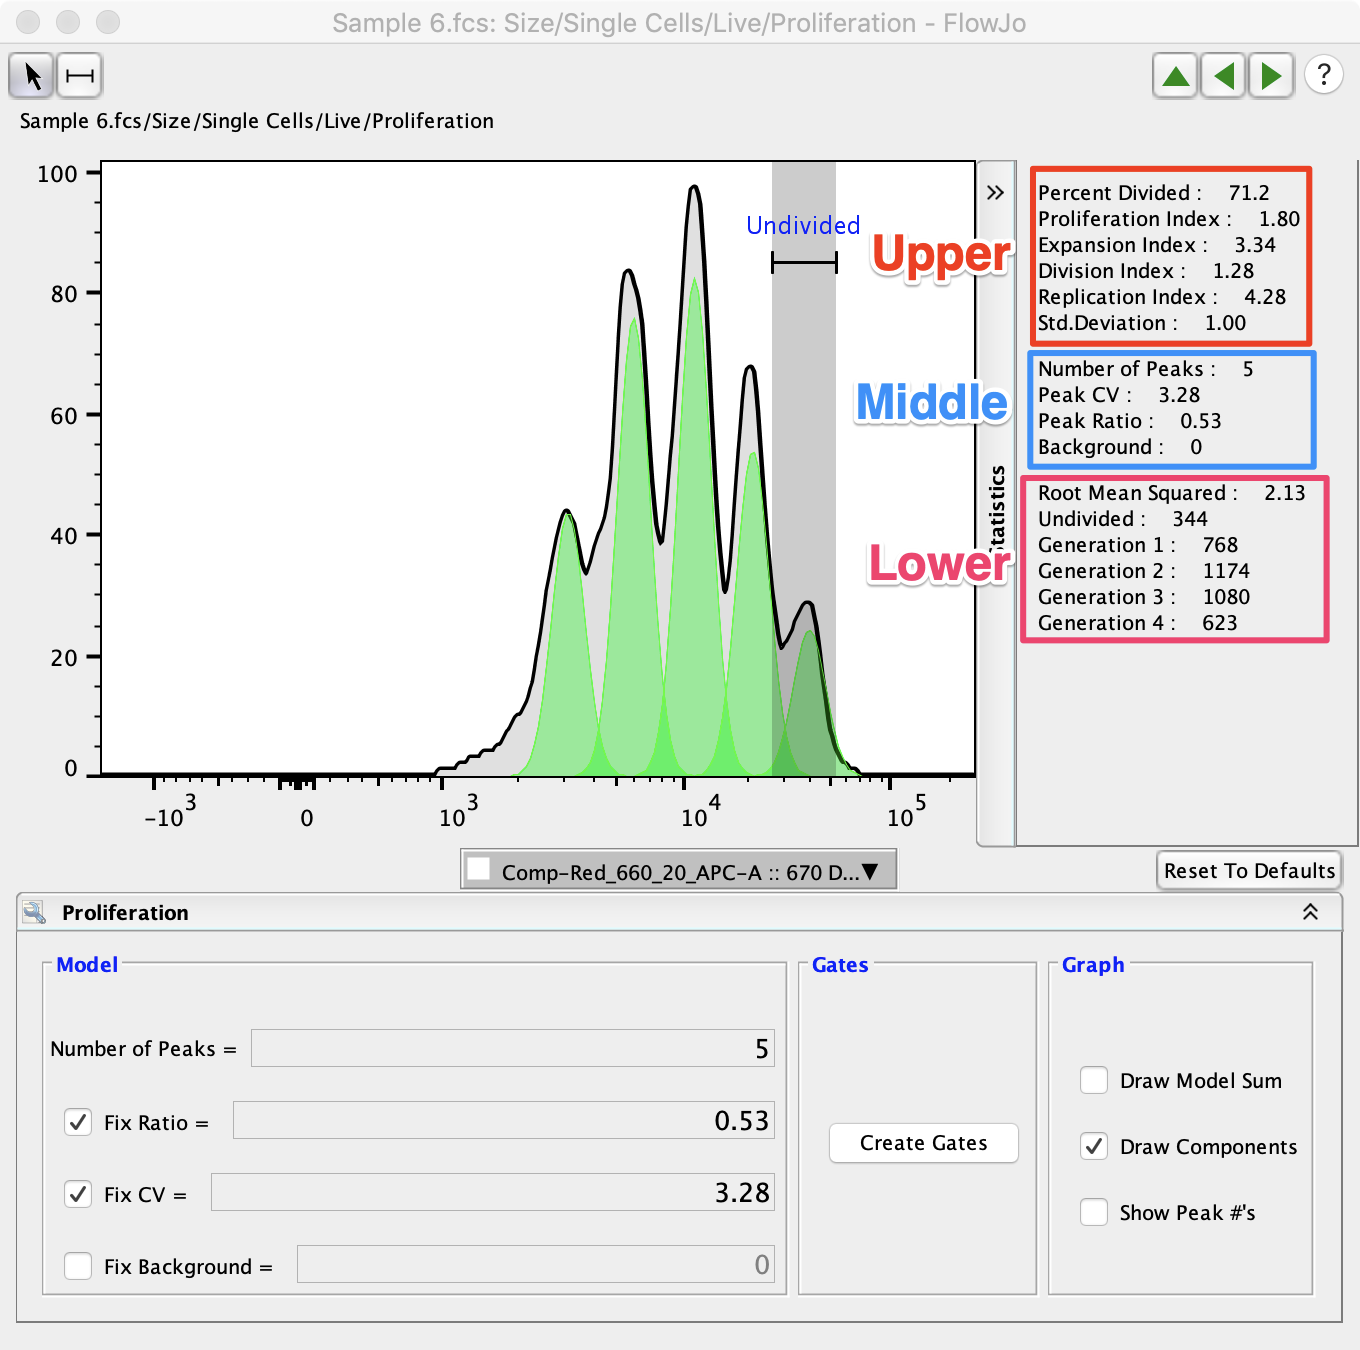
When proliferation is first applied to a sample, FlowJo will try to estimate the optimal Peak Ratio and CV to represent the population. These can be manually adjusted and fixed so that they are consistent across the proliferation analysis. The number of peaks also need to be adjusted to represent the number of peaks present in the analysis. Typically, FlowJo will set a peak ratio close to the expected 0.5 percent. It is expected that each time a cell divides each of the two cells in the next generation will have half as much dye, so their signal will be half as intense.

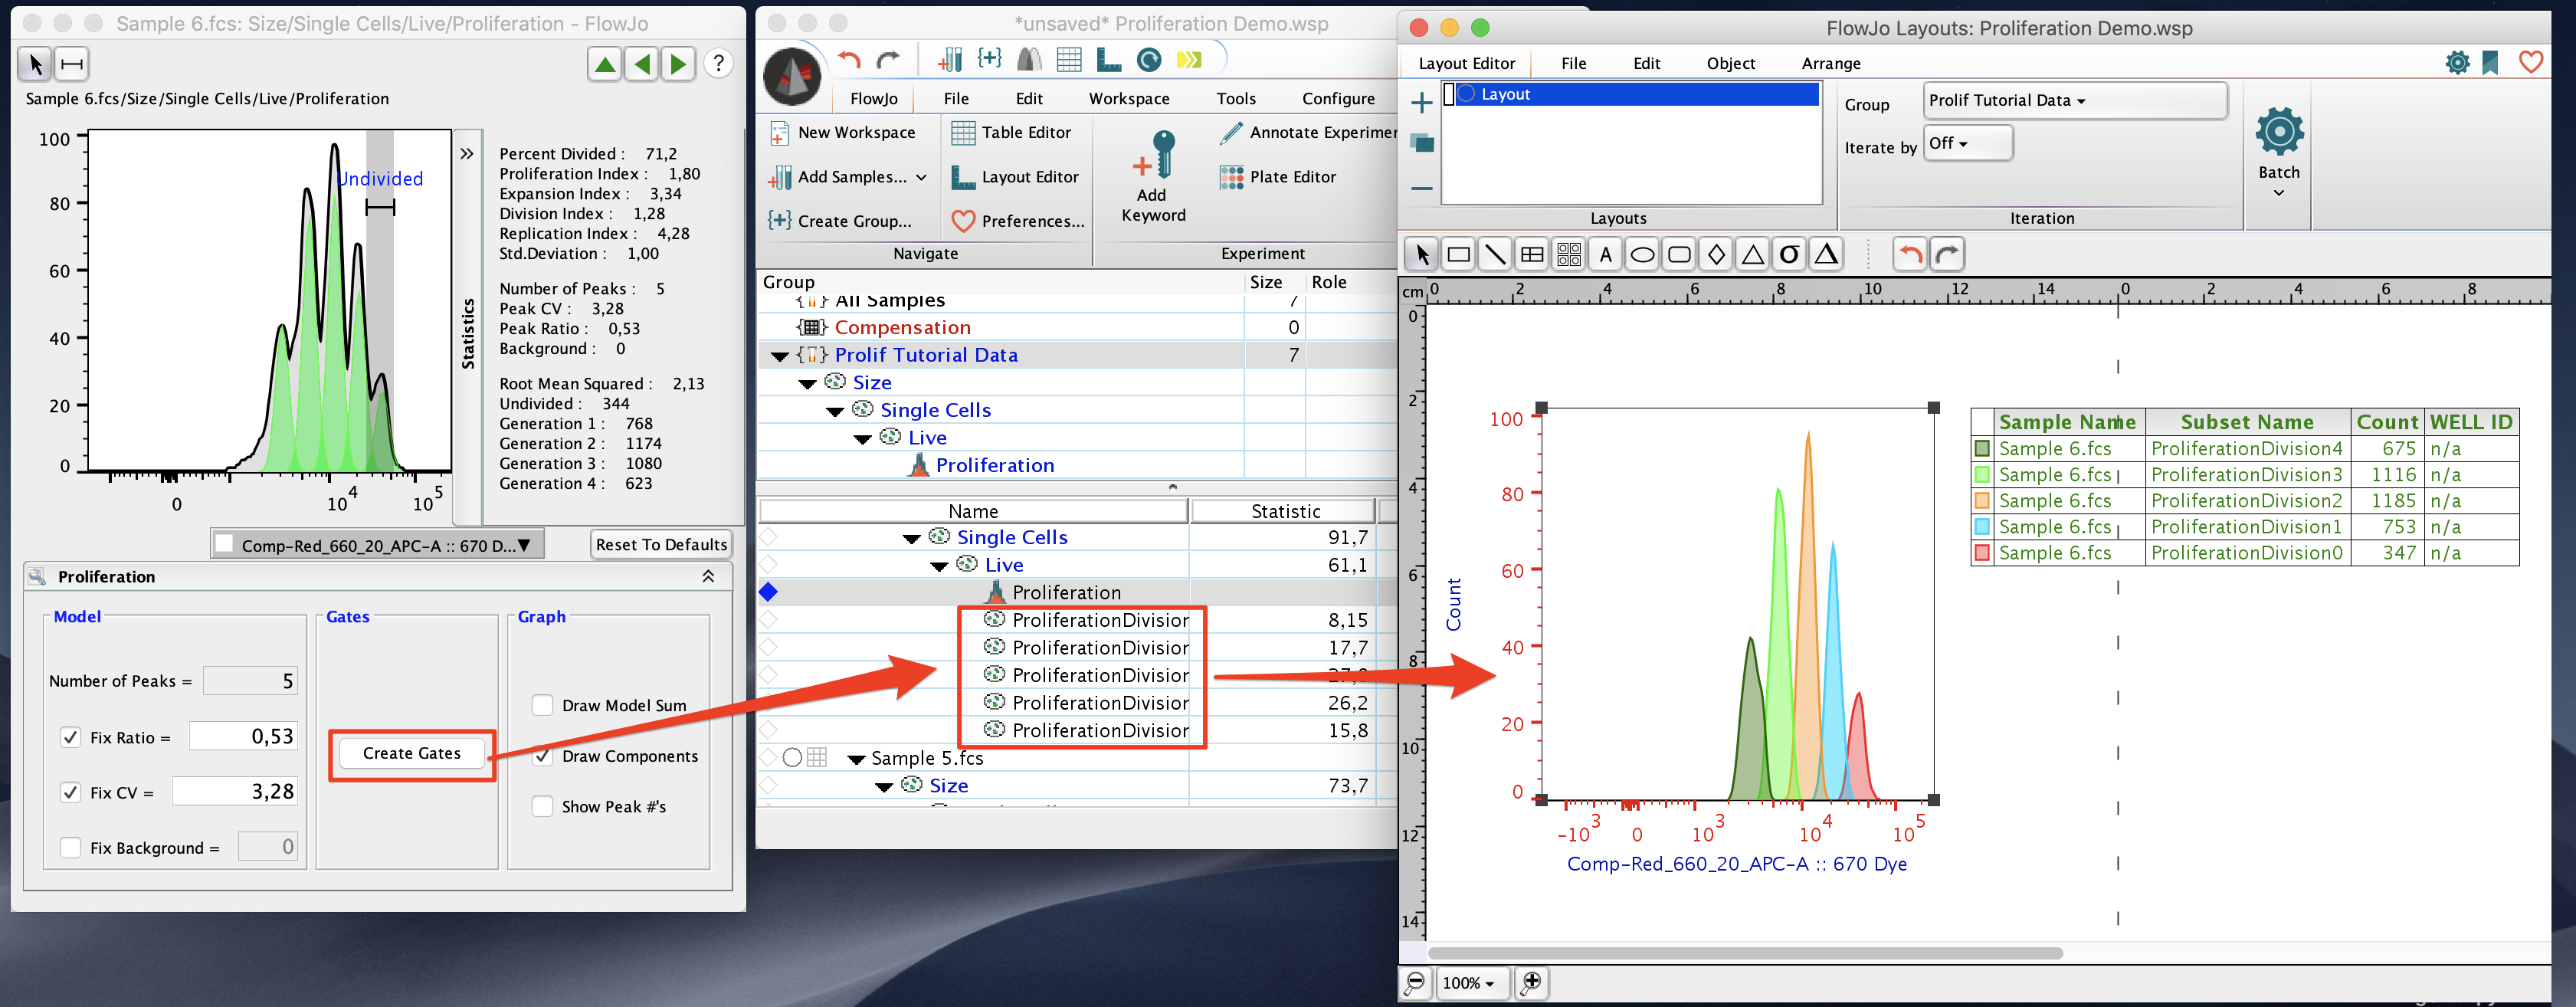
The “Create Gates” button can be used to quickly create gates on the population representing each of the proliferation peaks.
The graph options effect the proliferation display by adding peak numbers or by drawing the modal sum, which adds the overlap of the proliferation peaks together creating a shape similar to the raw data.
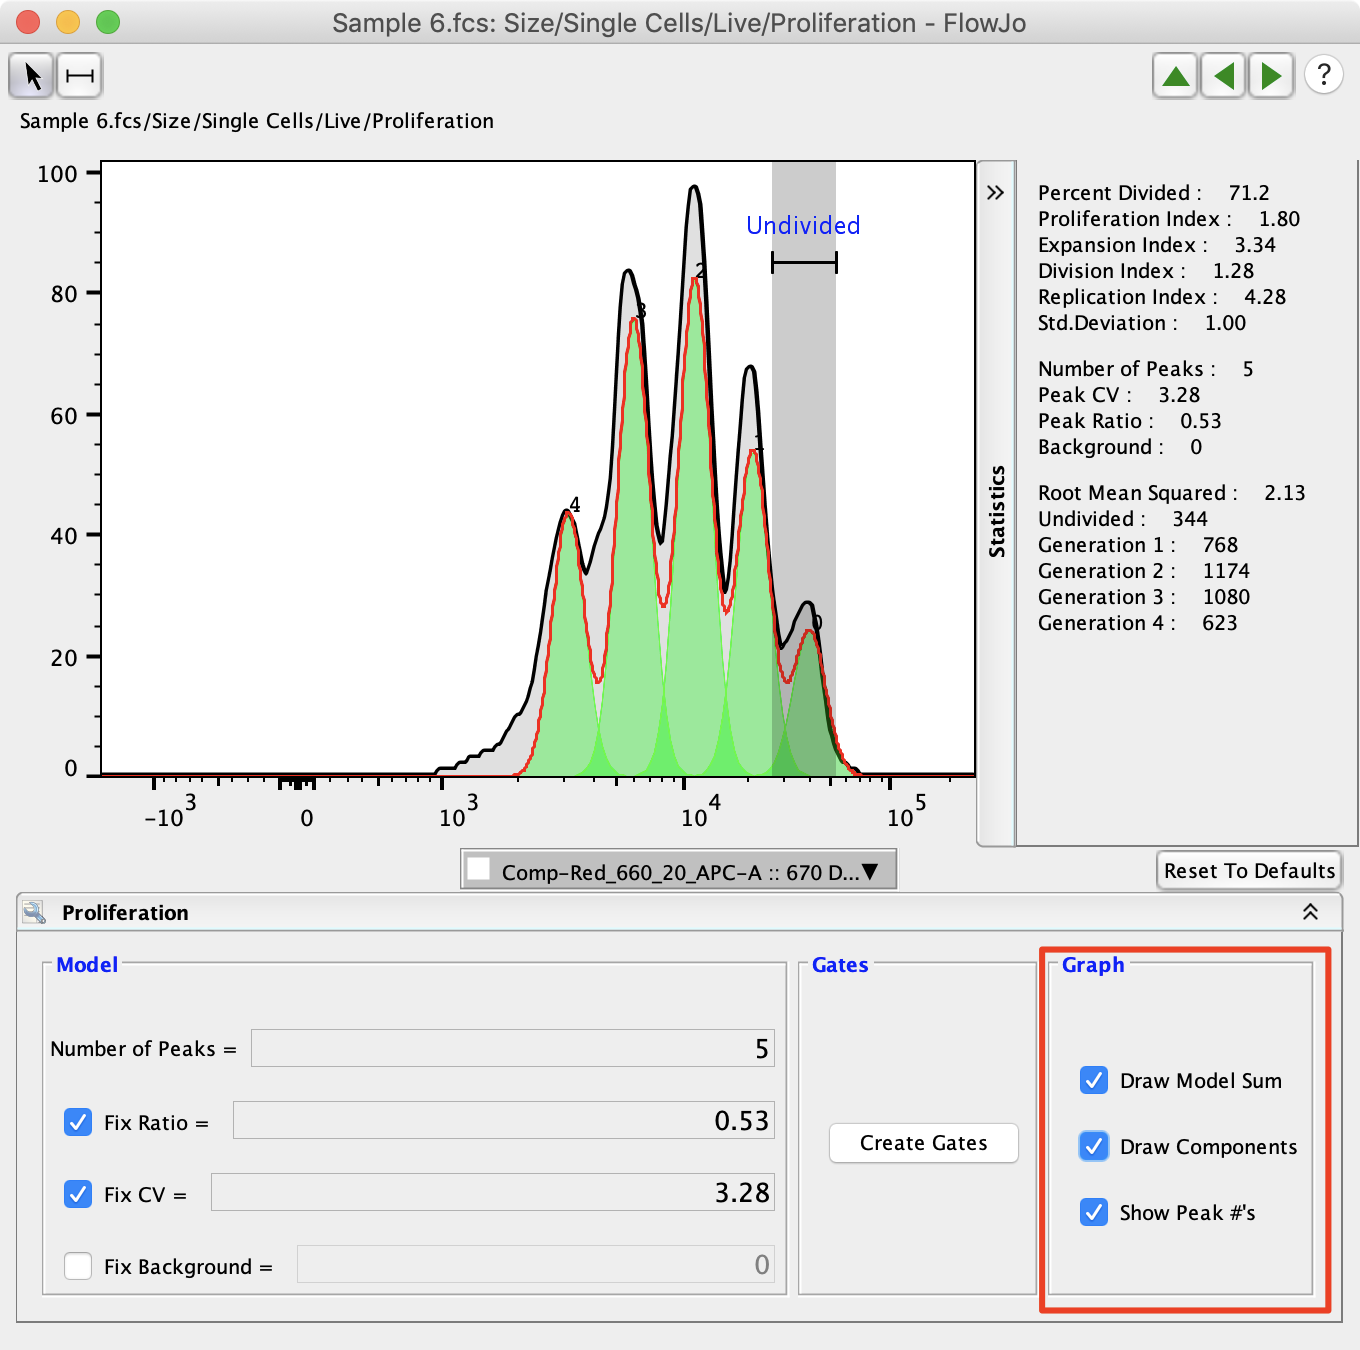
The statistics associated with proliferation analysis are displayed on the righthand side of the proliferation window. They are explained in more detail below. The upper set of statistics display values commonly analyzed in proliferation analysis. The middle set of statistics display the statistical values that were set by the user. The bottom set of statistics include the Root Mean Squared (RMS) and the cell counts associated with each peak. Generally, it is better to minimize the Root Mean Squared value as it represents the difference between the proliferation model and the raw data.
The proliferation node can be dragged into the layout window to create the proliferation model graph as well as its associated statistics. The proliferation node can also be dragged into the table editor to generate a table of the statistics used in the proliferation platform.

Proliferation Definitions
Show Overlay: After you Create Gates, select the Show Overlay button to open the Multigraph Overlay in the Layot editor, showing each generation’s gate displayed on a bivariate plot with the parameters of your choice. At right, a contour plot of each subpopulation on Forward vs. Side Scatter.
Division Index is the average number of cell divisions that a cell in the original population has undergone. This is an average even for cells which never divided (i.e., includes the undivided peak).
Proliferation Index is the total number of divisions divided by the the number of cells that went into division. The proliferation index only takes into account the cells that underwent at least one division, that is, only responding cells are reflected in the proliferation index. This is probably a more useful value to compare from sample to sample, as it considers only the fraction of responding cells.
The proliferation index more faithfully reflects what the biology of the responding system is; the division index reflects what the entire system is doing.
Another way to think about it—between the two, whichever value is smaller is the average number of divisions of all cells (including nonresponders); the larger value is therefore the average number of divisions for the responding population.
%Divided is the same as the Precursor frequency.
Peak CV is the coefficient of variation for the peaks. The same value of CV is modeled for all peaks. Typically, this value is 4-7%.
Peak ratio is the ratio of fluorescence between subsequent peaks. i.e., 0.5 implies that peak “n” has half as much fluorescence as peak “n – 1”. Values > 0.5 are not biologically meaningful, and usually arise when the log amp is not very good. The value should be close to 0.5.
As an example of how Proliferation Index and Division Index would be calculated, consider the following:
G0 = 15888
G1 = 32922
G2 = 13647
G3 = 897
Total Number of Cells: 15888 + 32922 +13647 +897 = 63354
Total Number of Divided Cells: 32922 +13647 +897 = 47466
The number of cells at start of culture: 15888 + (32922/2) + (13647/4) + (897/8) = 35872.875
The total number of divisions: (32922/2)*1 + (13647/4)*2 + (897/8)*3 = 23620.875
The number of cells that went into division: 35872.875 – 15888 = 19984.875
Division Index: 23620.875 / 35872.875 = 0.66
Proliferation Index: 23620.875 / 19984.875 = 1.18
Expansion Index: 63354 / 35872.875 = 1.77
Replication Index: 47466 / 19984.875= 2.375
Division Index: Total Number of Divisions / The number of cells at start of culture
Proliferation Index: Total Number of Divisions / Cells that went into division
Expansion Index: Total Number of Cells / Cells at start of culture
Replication Index: Total Number of Divided Cells / Cells that Went into Division
If the model does not fit the data in a preferable way, the Model Parameter Adjustments can be used to obtain a better fitting model.
As with all other platforms in FlowJo, the Proliferation Node can be applied to groups of samples by dragging.
Each generation can be analyzed separately (double click the generation number to open a graph).
Additional Proliferation Pages:
If you have any questions about platforms in FlowJo, or proliferation in particular, reach out to: flowjo@bd.com
Tags: FlowJo

