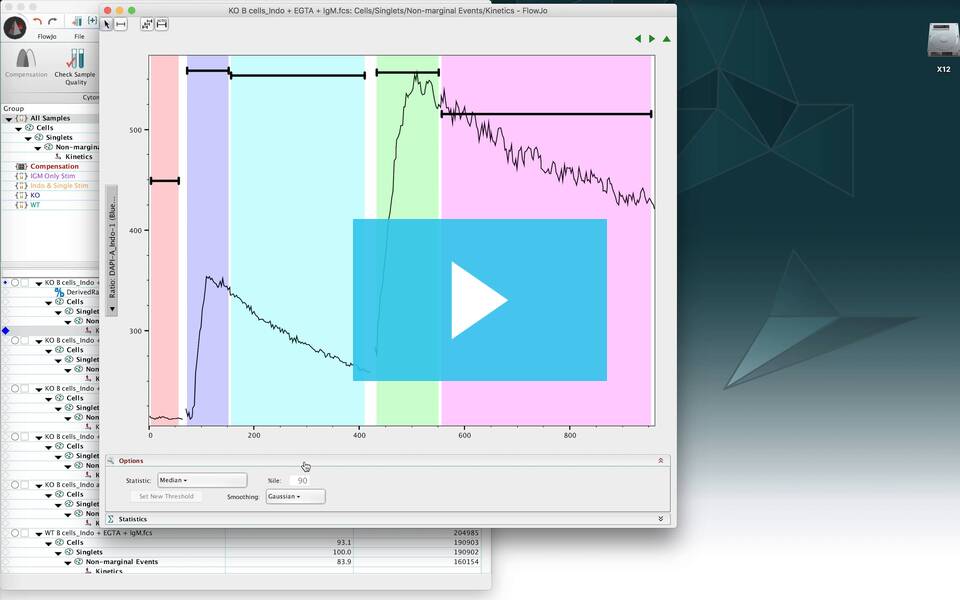
The kinetics platform is used to create models of changes in an individual sample across the collection time.
The kinetics platform uses the collected time parameter to create a graph of time versus the statistic of interest for the sample. The user may then divide the data into as many time ranges as they choose, or may select Auto-Range to allow FlowJo to fit time ranges to the data based on the peaks detected.
Note: If time was not collected, an approximate time parameter will be derived from the event number by assuming a constant flow rate.
Analyses are performed by selecting a population in the workspace and choosing Kinetics from the Biology band.
![]()
If a gated population is selected, then the kinetics analyses are performed only on the cells that fall within the gated subset. In the example shown below, a pair of clean-up gates has been applied to the data set, and a kinetics analysis has been calculated on the Lymphocytes population. The kinetics node can be dragged to the group as well to apply a kinetics analysis to all samples, copying the model settings from the sample from which the node was dragged.
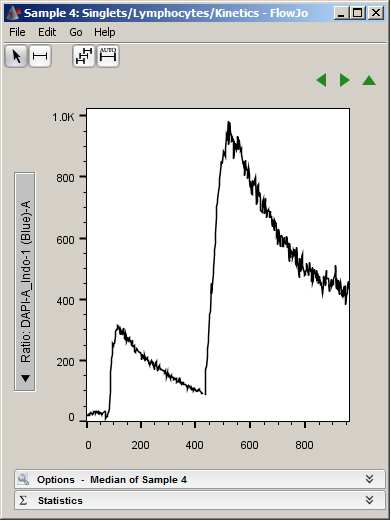
FlowJo opens a kinetics platform window when the kinetics node is applied to a population. If a parameter with the word ‘ratio’ in its name is present within the data it will be displayed on the Y-axis. If not, FlowJo will guess at the best parameter to use, and the user may click on the Y-axis parameter label to choose a different parameter if the guess is inaccurate. If no ratio parameter has been collected, but the individual parameters that comprise the ratio have been, the derived parameter platform can be used to create a ratio parameter. The default statistic applied to that parameter is the median. An example of the default plot is shown below.
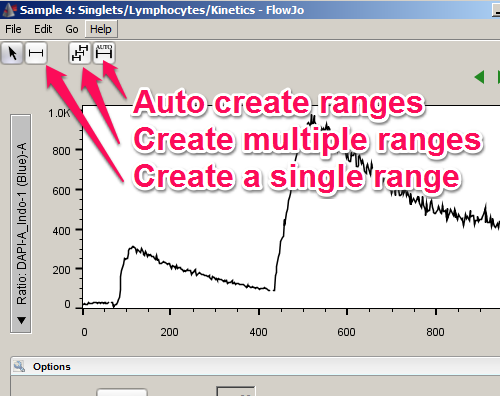
The next step is to create time ranges. Auto-calculate can be used effectively as a starting place, and additional ranges can be added as needed. Alternatively, the create multiple ranges button can be used to place the range partitions exactly where they are needed based on the perturbations to the collection performed during collection of a kinetics experiment. The three buttons used for setting ranges are shown below.
In the example shown below, auto-calculate has been used to divide the data up into three segments that follow the peaks in the data. One may want to isolate the second stimulation period by adjusting the pink and tan time ranges and adding a fourth range. To do so, click on the black range gate in the pink region so that the nodes at the edges of the gate highlight. Then simply drag the edge to the appropriate place.
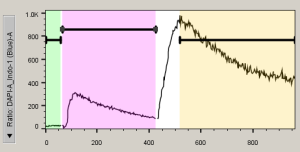
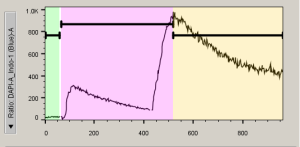
The tan gate can then be adjusted similarly, and a 4th time range can be added by clicking the Create a Single Time Range button.
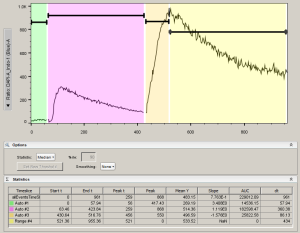
Notice that there are disclosure arrows below the model for both Options, and Statistics. The Options disclosure triangle allows the user to adjust the displayed Y-axis metric and the smoothing. The Statistics disclosure shows the calculated statistics for each time range, as they are created. Follow the links for explanations of each of the possible metrics, and the calculated statistics.
When the kinetics analysis is complete, it can be added to the group and various numerical and graphical outputs can be created using the layout editor, table editor, and exporting functionality.
Related:
Tags: FlowJo

