A threshold can be used to statistically define which cells are of interest
Some of the statistics that can be selected from the kinetics Options box take a threshold as a parameter. These compute statistics on the events with a Y parameter value greater than the given threshold.
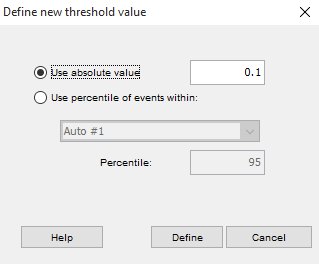
Clicking on the “Set Threshold” button, or selecting a threshold based statistic in the kinetics Options brings up the window shown below.

There are two choices presented. The first option is to use an absolute value. This enables the user to type in a value that is meaningful to the data set. The entry will be interpreted to be in the same units as the scaled value on the Y parameter. For example, if you have the ratio of free to bound Indo displayed on the Y-axis, the 0.1 in the graphic above would refer to a ration of 0.1. The second option is to calculate a given percentile for a specific time slice. The default settings select the 95th percentile of the first region, which assumes that the first region is the background level (pre-stimulation) of the selected Y-axis stat, and that we will ignore the upper 5th percentile in the calculation, allowing for outliers. If you have not defined time slices, then there will be no menu items selectable for ‘Use percentile of events within’.
The first threshold function (% of cells over threshold T) is just the percentage of events that are above the threshold for each time interval. If you were to define a certain threshold fluorescence value as the minimum for a cell to be considered a “responding” cell, then the resulting graph would show you the fraction of cells responding as a function of time. Each of the other functions gives you the appropriate statistic calculated only on the cells above the threshold value. Thus, you could, for example, plot the median fluorescence of responding cells to eliminate the averaging in of non-responding cells.
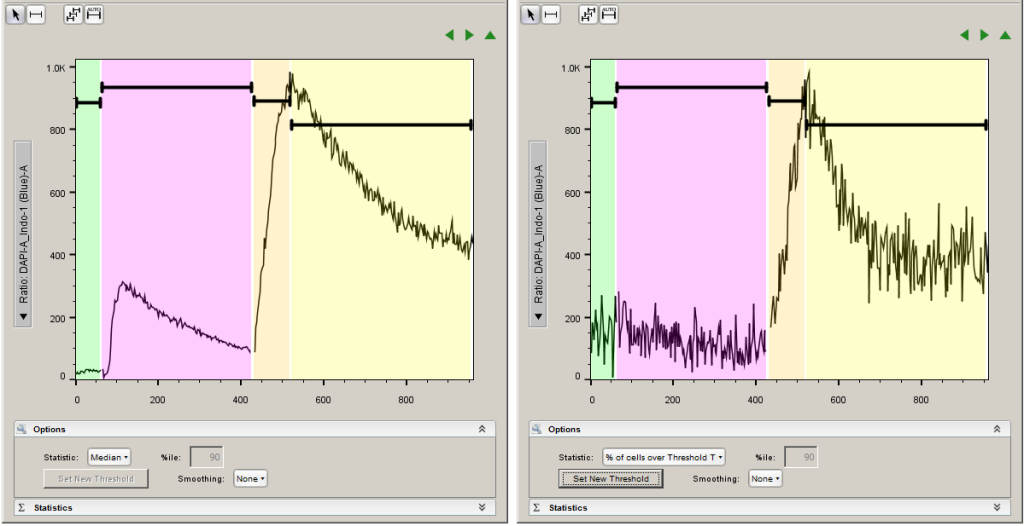
Once a threshold is set, the graph will be modified to reflect the new conditions. For example, the graphic below on the left shows data using the median of an Indo ratio. For the graphic on the right a threshold was set on the 95th percentile of the events in Auto #1 (the green background time slice.) The percent of events over this threshold was then selected as the Y-axis statistics, and now the plot on the right reflects this. Notice that the percentage of events in the green regions hovers around 5%.

See Also:
