This page is under construction; stay tuned for FlowJo Version 10.0.8 with Kinetics movies.
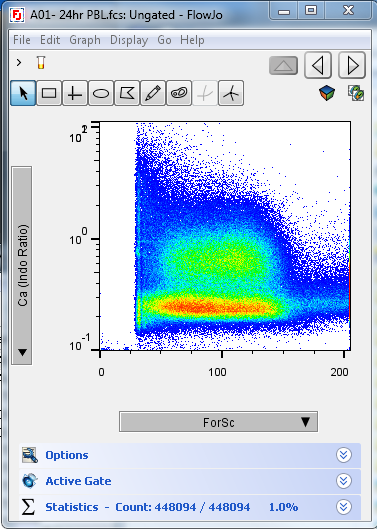
This time series is from a calcium-flux experiment. In this experiment, peripheral T cells were stained with anti-CD markers to identify subsets and loaded with Indo-1. The ratio of Indo-1 for a gated subset of CD4 T cells is shown as a function of time. Approximately 30 seconds into the collection, anti-CD3 was added to stimulate the cells. The time in seconds since the beginning of the acquisition is shown in the upper left hand corner.
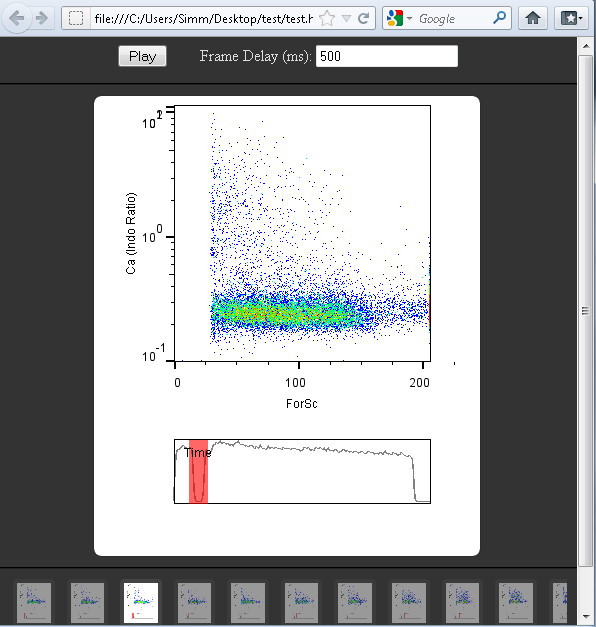
Note: You can make this movie by clicking Graph menu, Make movie and then selecting the “Time” parameter as the driving variable.


When this movie is done, FlowJo will show you a web-browser based player for the playback:

You will notice that about 230 seconds the first indications of calcium mobilization can be seen by the appearance of a peak of high Indo-1 ratio (Ca, X axis). Within 50 seconds after that a peak of high calcium concentration appears (at about 2 on the Ca scale), which quickly resolves into the main, intermediate peak (about 0.7 on the Ca scale), lasting to the end of the collection.
In FlowJo, or when you view the movie using a third-party application, you can view the movie frame-by-frame, or use the mouse to scan back and forth over a small time period: this gives you the ability to view small time-slices with high precision so you won’t miss anything.
View the next sample movie, or go back to the movies overview.
