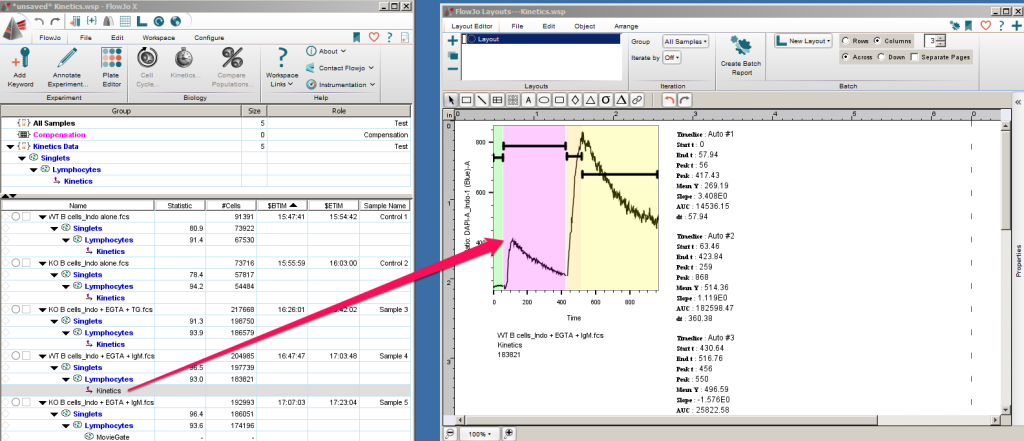
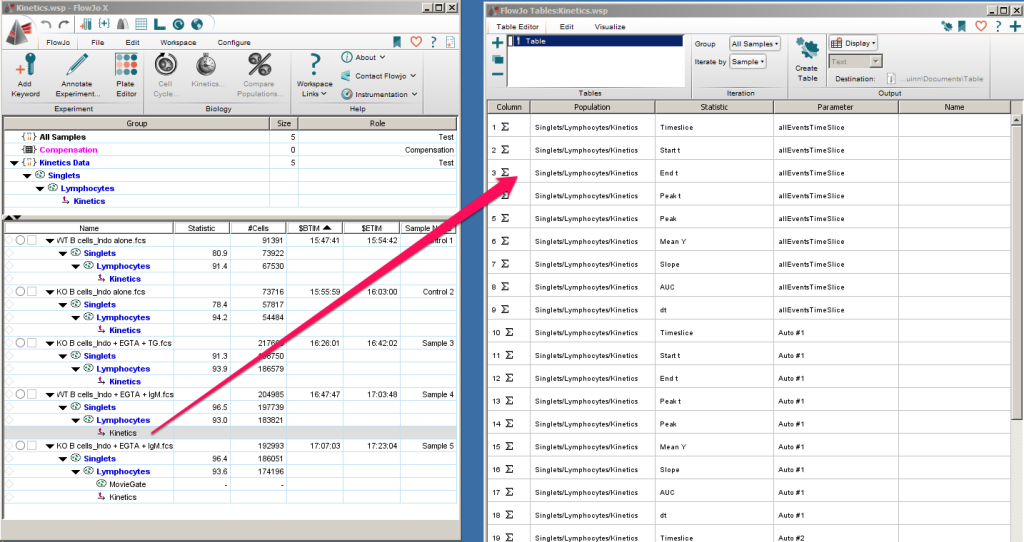
Data can be exported from the kinetics platform to the layout editor, the table editor, or as binned data.
Exporting graphics to the layout editor
Like any other node in FlowJo, the kinetics node can be dragged to the layout editor to create a graphic. As you can see in the graphic below, the model with time slices will be displayed in the LE, along with summary stats as an editable text box. If you have applied a kinetics analysis to a group of files, this layout can now be batched. Upon clicking the ‘create batch’ button FlowJo will render the kinetics model of all samples in the group with any modifications made to the original file in terms of line, color, text formatting, etc. applied to all files. 
Exporting statistics to the table editor
Similarly, the kinetics node can be dragged to the table editor. Dragging and dropping the node into the TE creates an entry including all of the summary statistics for each of the time slices. Any of the statistics for any of the regions can be removed by clicking on it then pressing delete on your keyboard. A stat can be given a custom name by typing an entry into the ‘Name’ column. When ‘Create Table’ is clicked if you have created a kinetics model for all files within the selected group, FlowJo will populate a table with the statistics from all files in the group.

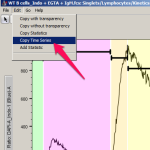
Binned histogram data
To export the binned histogram, click Edit menu, then Copy Time Series. This will place a 256 bin representation of the plot you see in the kinetics window into your clipboard, presented in two columns. One column lists the approximate time value, and the other, the fluorescence at that time value for the parameter shown on the Y axis (usually, ratio.) These columns of data can then be pasted into any software that accepts delimited data. The figure below shows it pasted into a spreadsheet.


See Also:
