FlowJo vX makes it easy to batch overlays and customize your graphical reports.
Batching overlays is a powerful tool that enables you to view any number of control samples overlaid with test samples across an entire experiment. The general process is the same for all overlay batches: create an overlay in a layout, specify (lock) the control sample(s), and then batch the layout. Filtered batching can be used to produce reports where multiple overlay combinations are necessary. The following sections describe various overlay batching methods, beginning with a simple example and gradually building to more complex combinations.
Standard Overlay Batching
The most common use case for a basic overlay batch is to show a sample vs control overlay. For instance, you may want to see the shift in expression over time of a particular marker (e.g. CD25, CD44) after stimulation of naive T-cells. For this task we’d like the control layer to stay constant, while the dependent layer (stimulated cells) is updated across the different samples.
Here is the process:
1. Create the initial overlay by dragging one population on top of another in the Layout Editor. The figure below shows two popular types of overlays (histogram and dot plot).
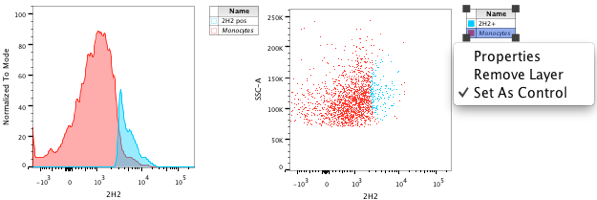
2. Using the Legend, right-click the control data layer, and click “Set As Control”.
Your resulting batch will take every sample from within the current group selection and overlay it with the locked control sample(s).
Batch by Panel
If you would like to overlay and batch sequential samples, set the iteration panel number size. For example, you might desire to overlay every other sample so that the report provides the following sample overlay sequence: 1/2, 3/4, 5/6, etc.
Here are the steps to achieving this:
1. Create the initial overlay of sample 1 and sample 2.

2. Set the iteration option to Panel and the value to 2.
3. Batch the overlay.
These settings will work for as many consecutive samples as you’d like in your overlays, i.e. panel size of 3 for a resulting batch report of overlays for samples 1/2/3, 4/5/6, 7/8/9, panel size of 4 for a resulting batch report of overlays for samples 1/2/3/4, 5/6/7/8, etc.
This type of batch is easy to setup, however, has disadvantages over the “by keyword” method described below:
– data has to be sorted properly in the Workspace window. Bad sort = bad batch.
– this method is not robust enough to handle missing files. If for some reason an FCS file is missing (technical error, etc) – the batch breaks.
Well-by-Well Batching
Sometimes two equivalent well-plates need to be displayed well-by-well. This is another example of a panel batch, but slightly more complicated.
There are two ways to do a well-by-well panel batch; using an existing keyword, or by creating a new keyword(s) to sort the data. The first method entails using the “Well ID” keyword, provided it was annotated during acquisition, to sort your data in the workspace:
- Load the plate data you wish to compare side-by-side in the workspace.
- Under the configure tab in the settings band, select “Add Columns”.
- Choose the Well ID keyword from the list. A new column “Well ID” will be added to the Workspace
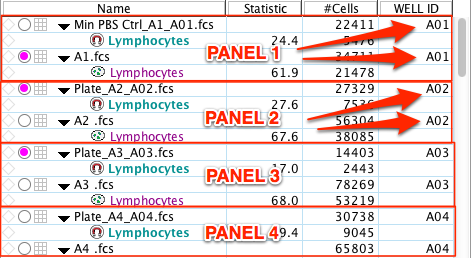
- Double click on the Well ID column header. Your samples now should be arranged in the proper panel pattern for the Layout Editor (i. e. Sample A01 from Plate 1 and Sample A01 from Plate 2 are sequentially juxtaposed in the workspace, see image below).
The second method to arrange your Workspace into panels for well-by-well panel batch, assumes the Well ID keyword was not annotated during acquisition. This necessitates the creation of a new keyword in the Workspace to sort the data properly. The simplest way to do this is to add plate data to the workspace in two different groups:
- With one plate group selected navigate to the Workspace tab and select the Keywords band.
- Select “Add Keyword”.
- Name the keyword (e.g. Well ID, panel number, etc). A new keyword column should be added to the Workspace.
- With the first sample in the group selected, double click in the blank cell in the new keyword column.
- Enter the number “1” in the cell.
- Navigate to the Keywords band again and this time select “Create Keyword Value Series“.
- In the dialogue that follows make sure that the keyword “Well ID” or whatever you named it, appears at the top.
- Enter the number of samples or wells that you need to assign a value to (e.g. 96) under the Rules section of the dialogue: Fill (blank) value(s) starting from current sample. See image below.
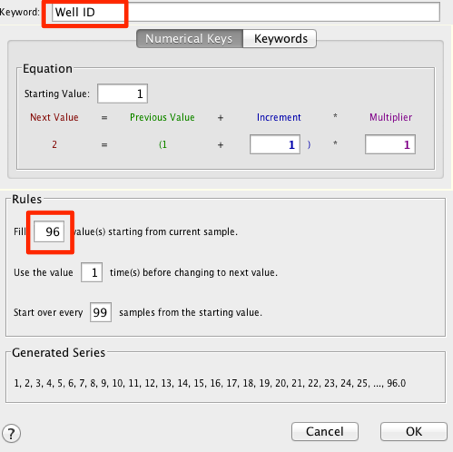
- Click ok. All of your samples within the group should be labelled 1-96.
- Repeat steps 1-9 for another group of plate data.
- Combine plate data from both groups into a new or existing group.
- Double click on the new keyword header in the workspace to sort the data by that column.
- All the samples should “line-up” into correctly arranged panels (sample A1 from Plate 1 is next to sample A1 from plate 2, etc.)
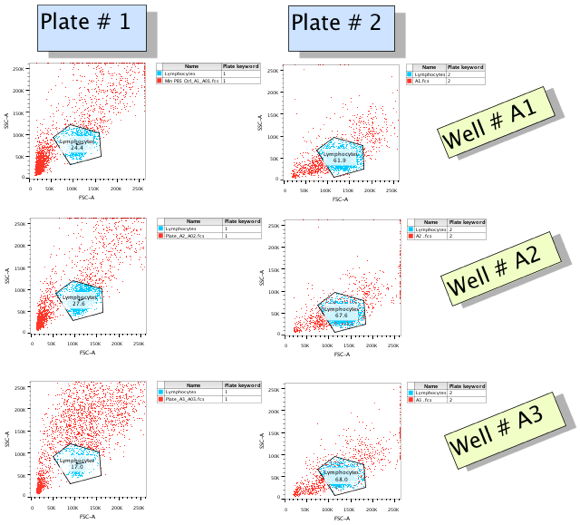
The batched overlay of samples from a well-by-well panel are shown below. This method can be extended to as many plates as you wish.
<img alt=”” src="https://lh3.usercontent.com/4d4H2dhwKRGYlp5OmsN7-Ieg2Q96ja1V8NjmwfKM8IqBO7AdQp6t601Etf-SbNNuDDUsIIvdosqsyltOoZHVGvakNEnc5IIFAE58wKRQc83RCBhvlxC6z7Qr” width=”580px;” height=”525px;” />
A detailed description of this process is described here.
Batch by Keyword Filtering
This batch operation utilizes two keywords from your FCS file and gives them special designations as either “iterator” or “discriminator”. The iterator will be common among the plots to be overlayed, and the discriminator will be distinct among those plots. A simple example will show how to utilize this process for your specific experiment and report goals.
Say the goal for a certain report is to make a batch that ensures samples taken from different days but with same patient ID are overlayed with each other:
SampleA1 from Day 0/SampleA2 from Day 2
SampleB1 from Day 0/SampleB2 from Day 2
SampleC1 from Day 0/SampleC2 from Day 2
SampleD1 from Day 0/SampleD2 from Day 2
For this example, the iteration keyword is set as $Cells (this keyword was annotated to contain the patient ID) and the discriminator keyword set as Day (keyword was annotated to contain the day the sample was collected). The keywords you use for iterator and discriminator will likely be different and should be determined by the goal of your experiment and the annotation of your FCS files. For this experiment, the set up would look like this:
| KEYWORDS | Sample Name | $Cells (iterator) | Day (discriminator) |
| KEYWORD VALUES | |||
| Sample A1 | ID1001 | 0 | |
| Sample B1 | ID2001 | 0 | |
| Sample C1 | ID3001 | 0 | |
| Sample D1 | ID4001 | 0 | |
| Sample A2 | ID1001 | 2 | |
| Sample B2 | ID2001 | 2 | |
| Sample C2 | ID3001 | 2 | |
| Sample D2 | ID4001 | 2 |
FlowJo needs to be able to understand that certain samples share some property. For this type of operation to be successful, every sample in an overlay requires that the keyword chosen for iterator have the same value and the keyword chosen for the discriminator have a different value.
The keyword setup will allow a batch of overlays which would be accomplished through the following steps:
- Create an new layout and set the iteration value and the discriminator value ($Cells and $tube for this example).
- Overlaysamples A1 and A2
- Batch
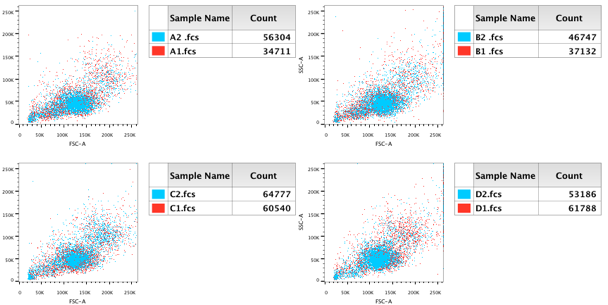
The resulting batch (shown above) will iterate over the $Cells keyword, so each batch panel will contain the overlays of the different patient IDs. So, there will be four overlays in the batch report of Patient 1, 2, 3 and 4.
If you have questions on getting your batch results to match your experimental goals, please email us at techsupport@flowjo.com.
For more information on Iteration and batching click here.
More Layout Editor links below:
Statistics, Tables and Equations
Tags: FlowJo