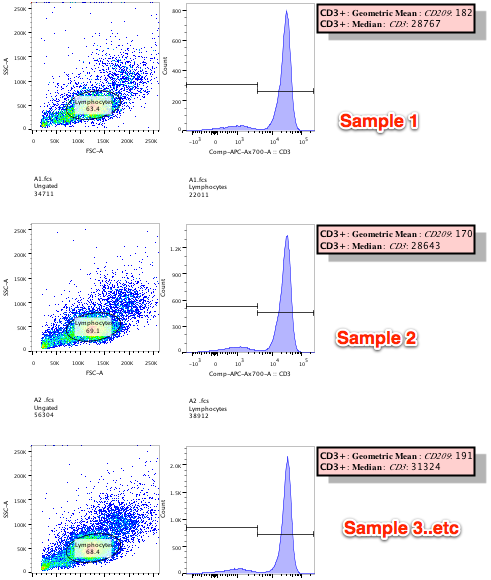
Batch processes save you time by allowing you to design a prototype reports (tile) and then tell FlowJo to apply that tile to groups of samples.
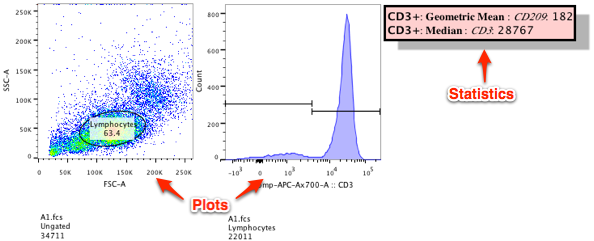
In the case of a simple batch layout, each tile of the batch corresponds to one sample in a group. A tile is group of objects (plots, statistics tables, text, and/or objects) in the Layout Editor that are intended to be batched together. For example, a simple tile might consist of a pseudocolor dot plot, a histogram, and a set of statistics. Batching this tile over all of your samples will produce a set of tiles containing pseudocolor dot plots, histograms and statistics that contain information about each individual sample contained in the workspace. This is useful in cases where the same information is desired for each tube.
Creating a Simple Batch
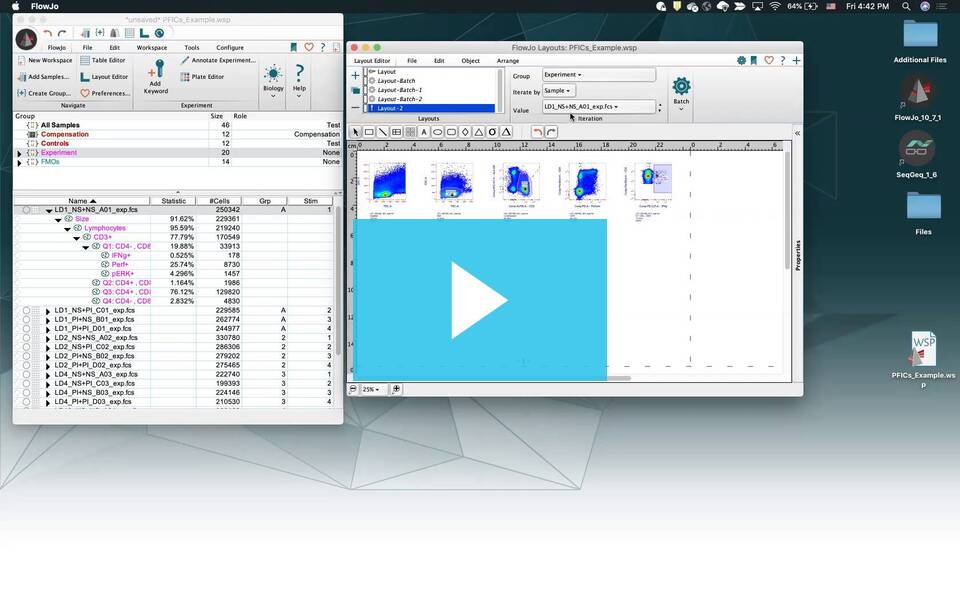
To create a simple batch in the layout editor, follow the procedure below.
Design/apply gating scheme and statistics to a prototype sample in the workspace.
- Drag those gates/statistics onto all samples (batched gating).
- Drag prototype populations and/or statistics into Layout Editor. (This will create the initial tile.)

- Customize layout as desired (add annotation, change color, font, add additional graphs from the same sample, etc.)
- Adjust page size as desired to fit the tiles.
- Make sure Iterate By settings show “Off” or “Sample”.

- In the batch band, select the geometry of your final report (tiles in columns or rows, across or down).

- Click the Batch button.

More complex batching operations are illustrated here.
More Layout Editor links below:
Statistics, Tables and Equations
Tags: FlowJo

