There are four main steps to create a successful batch in FlowJo:
- Build a Prototype tile
- Choose the batch type and destination
- Check group selection and workspace sort order
- Run the batch
Building a Prototype Tile
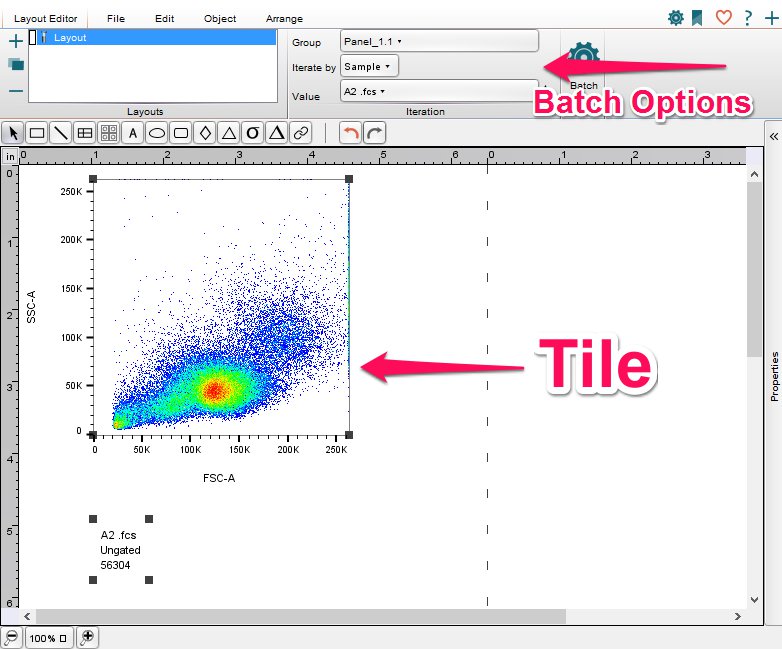
After performing all your necessary analysis, building a prototype tile is the next step. By building a prototype tile you are showing a computer, in this case FlowJo, how you want something done so that it can repeat the task as many times as needed.
Create a new layout, add plots and statistics, lines and text, and/or any other elements you want repeated. The batch repeats it with the data of samples from group ‘X’ when you perform the batch. Everything that has been added to a layout prior to batching is considered one tile. Depending on the type of batch you run, the result will contain one tile for each sample or set of samples in a panel.

Helpful hints
Batching operations are powerful, but they do take a little getting used to. To avoid banging your head against the LSRII in frustration and thereby upsetting your core manager, use these hints:
- Understand the pattern of your dataset(s). This is the true kernel of knowledge that makes the difference between frustration and flow. Know your keywords! Keywords exist to make your life easier. Use them! If you use your metadata properly (patientIDs, cell types, staining protocols and other annotation) you too can harness the true power of FlowJo. In addition to completing your work in a fraction of the time, all your labmates will marvel at your genius.
- Be aware of, and double check, the group FlowJo is using before running the batch. If you see missing charts or charts with no data or statistics, or an error is given, check that the selected group in Layout Editor on the Iteration band matches the desired set of samples.
- Be aware of sort order in the Workspace. This is especially important when batching by panel. FlowJo always looks at the Workspace window when it is pulling charts into the layout. If sorted in a way that doesn’t match the desired pattern of the dataset, missing data or charts may appear. If samples have a Well ID keyword, samples will now be sorted by the keyword Well ID, or if that keyword is not found, then by the sorted by Preference.
Batch types and definitions
Attribute-Value Pairs
The technical term for a keyword with information is an attribute-value pair. The keywords in an FCS file are organized in attribute-value pairs. The attribute is the name for the type of data recorded, e.g. $Date. The value is the data recorded for a particular tube, e.g. November 22, 2011. In the context of iterating by keyword, if the date attribute were used, one tile would be produced each time FlowJo came across a sample with a different value for date.
Changing the Batch Type.
Depending on your experiment, you may want to see all of the samples together in a single view, see the same plots for each tube you analyze, or analyze a set of tubes together in a panel, and get different plots from different markers in one panel. Sometimes panels are all the same size, and other times the number of tubes in a panel is not constant, but keyword values (e.g., the date or sample identifier) will be present to help filter the results to display only the tubes you care about. If there is a distinct numerical pattern to your dataset, batching by Panel is an efficient way to produce a batch. For example if every 4th sample in your dataset was stained for CD4, the Panel size would be set to “4” and FlowJo would produce a batch containing the 1st, 4th, 8th, 12th, etc. samples.

Changing the Iteration Value
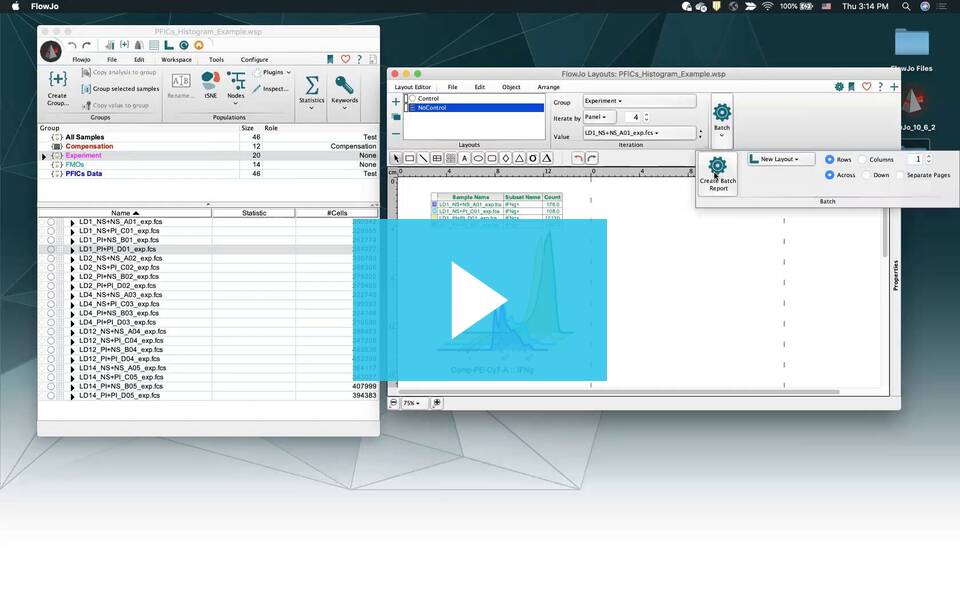
There are several ways to change the iteration value. You can use the popup menu in the layout editor window to show the layout for any value in the current group. When you click the Batch button you see the a batch is created. The Batch band has placement controls (called Geometry.) You can specify the number of rows or columns you want to generate, and whether the new items are arrayed left to right (Order Tiles Across) or top to bottom (Order Tiles Down.) Check the box Position the tiles on separate pages to separate each iteration onto its own page. Iteration lets you choose which group the batch process will iterate through. All groups you have defined in the Workspace will appear in the Group drop-down menu.
Setting the Iteration Attribute
Other times, reports are created where each frame contains data from more than one tube. Examples of multi-sample reports could be several tissues from a common animal, multiple doses of a common drug, or cross patient studies using blood collected over time. In cases such as these, it is not enough to simply process successive tubes in a batch report. More sophisticated organization is required. Iterate by Panel is the easiest method of iterating. If you want to overlay two tubes and batch process the layout so that tube 2 is overlayed on tube 1 and then tube 4 overlays tube 3 etc. choose Number of Tubes in each Panel = 2. For more complex iteration, choose a Keyword value for the iteration variable. The popup menu of iteration types lists all the keywords found in all of the samples of the current group. Select the keyword that you want in common in all frames of your layout. The value will vary in each of the frames. By selecting a different group in the workspace, or by selecting a custom group from the Batch dialog, you can change the set of samples to be processed in the batch. For example, if you set the Iteration Type attribute to be the keyword $Cells, where you have a Patient ID entered into the $Cells keyword, then FlowJo will examine all of the tubes in the current workspace, and generate a list of the unique values of $Cells. These are then displayed in the Layout editor in the popup menu just below the Batch button. By selecting any of these values from this menu, FlowJo will change the current layout view to show graphs and statistics drawn only from tubes with that value of the Iterator. By setting this popup menu to Off, you are telling FlowJo to use all of the original graphs that you dragged and dropped into the layou). This is the way in which you can build reports which select graphs and statistics from different tubes and put them all on the same page.
Multiple sample Iteration
The Iteration Options also provide the ability to specify one or more discriminator keywords. These fields provide the value that must stay constant, while the Iteration attribute changes through each of its successive values.
For example, if you have a ten mouse study, and for each mouse you collect three different tissue types, then there would be thirty tubes in the experiment. You want to produce a ten page report, showing the graphs and statistics for each mouse, one per page. You’ve acquired the data such that the mouse identifier is stored in the FCS file’s $SMNO (sample number) field, and the tissue type information is stored in the $CELLS field. Set Iterate Over… to $SMNO and set Discriminate By… to the keyword $CELLS.
More Layout Editor links below:
Statistics, Tables and Equations
Tags: FlowJo
