Quickly export a Graph Window in a variety of formats to generate a figure in a report, email an image of results to a colleague, or update a webpage. Whatever your need, FlowJo allows you to save and move graphs to multiple programs.
All Graph Window plots can be exported as image files, but histograms and cumulative distribution plots (CDF) can also be exported as text. For more information about exporting histograms and CDF as text, see below.
If you are working with a single FCS file or simply want to export one graphic rather than batch, FlowJo lets you do this in a couple of different ways. You can export a Graph Window by saving the graphic file to your desktop or hardrive, or you can copy the graphic to the clipboard and paste it into another program.
Saving Graphic As
Export a Graph Window by saving it to your desktop or hard drive. The following steps will guide you through the process
- Select the Graph Window you wish to export (e.g “B1.fcs”, “Sample 1.fcs”, etc.)
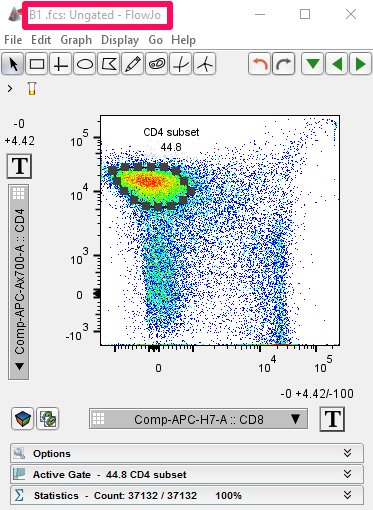
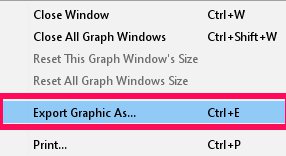
- On the menu bar at the top of your screen, click the File tab and select Export Graphic As (shortcut CnTRL S/ CMND S). FlowJo vX allows you to export a graph window as a .PNG, .JPG, .GIF, .EMF, .PDF, or .SVG file.
- Choose the location where you want to save your file and click Save.
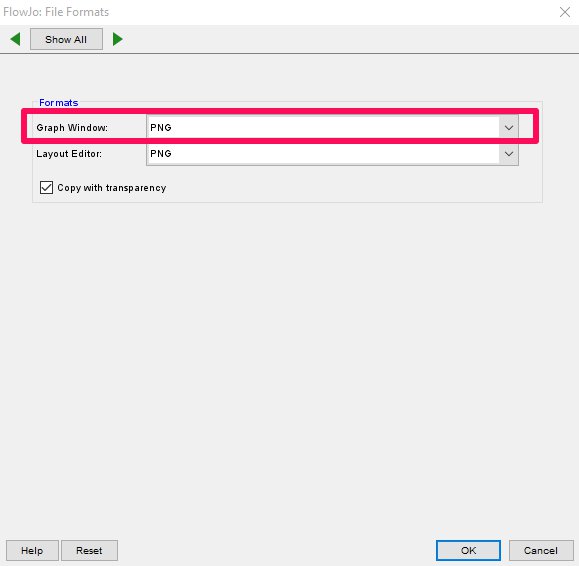
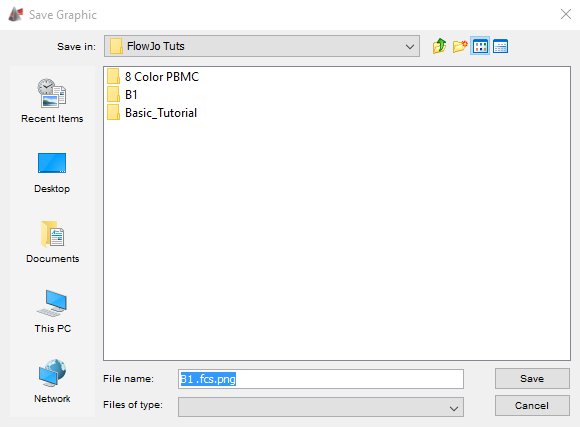 NOTE: The default setting is to export as a .PNG file, but this can be changed to any of the other file formats mentioned in Step 2 by going to the preferences window and selecting the File Formats option (see below).

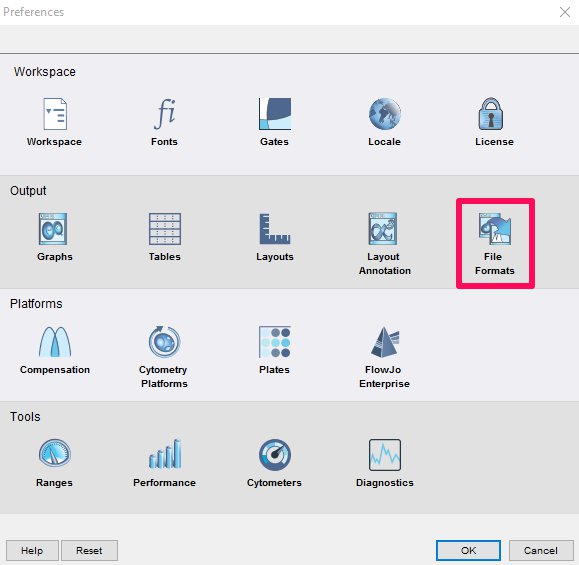
Within the File Formats window select a file output from the drop-down menu in the Formats panel next to “Graph Window” (see figure below).

NOTE: If you work on a Mac, you may see this dialog when you attempt to save:

If you see this dialog, you will need to manually add the file extension to your file before hitting save.
Copying with or without transparency
To copy the Graph Window to the clipboard, first select the Graph Window you wish to copy. From the menu bar at the top, click “Edit”. You can then choose to copy with or without transparency. If you copy with transparency, the image can be placed on another background without the presence of a white box behind it. Copying without transparency effectively places a white box behind your image. You can then paste the image into an imaging program like Illustrator, PowerPoint, or Excel.

Note: In the case of image transparency, be aware while copy/pasting from FlowJo to another program as an image inside FlowJo is still treated as a graph node, but the program the image is being exported to may not treat the image the same way.
Copying/Saving Univariate plots as text
Univariate plots (histograms, cumulative distribution function (CDF)) can be exported as text for use in recreating the histogram in another program.
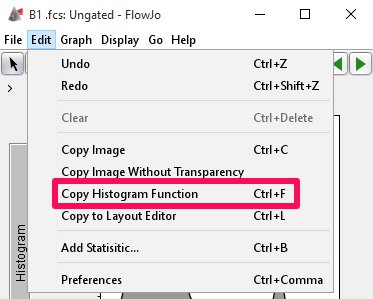
To copy a histogram or CDF as text, choose Copy Histogram Function (shortcut CNTL F/ CMND F) from the Edit menu.
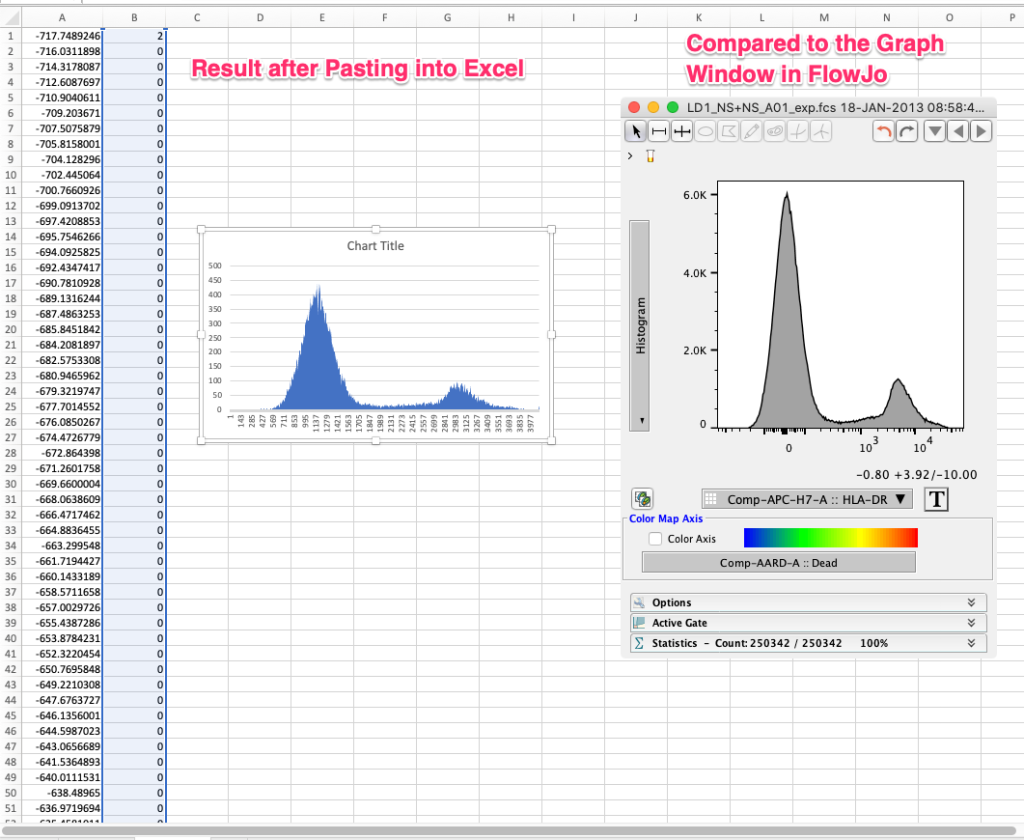
This will copy the binned values of the data to your clipboard. You can then paste this into a spreadsheet program (e.g. MS Excel, Graphpad Prism) and recreate the histogram. Two columns will be pasted. The first is the fluorescence value where the bin starts. FlowJo utilizes 4096 bins calculating statistics, so there will be 4096 rows. The second is the number of events for a given bin. To recreate the histogram, simply make an area chart of the event count column.
Tags: FlowJo
