The Graph Window is at the heart of data analysis. FlowJo vX has incorporated several menu options to ease the export, analysis, printing, saving, and overall functionality of the Graph Window.
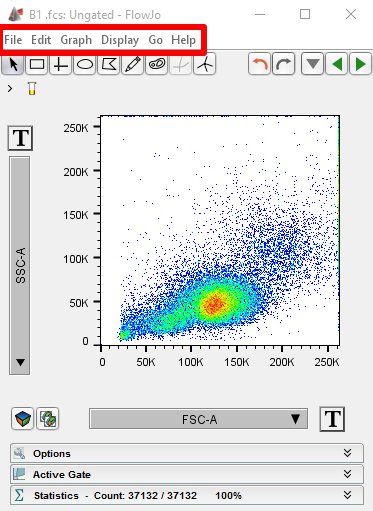
The Graph Window menus in the red box are explained below.
The File menu:
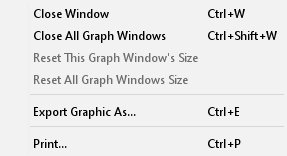
- Close: Closes the active graph window.
- Close All Graph Windows: Closes all open graph windows.
- Reset This Graph Window’s Size: Resets current graph window to the default size.
- Reset All Graph Windows Size: Resets all graph windows to the default size.
- Reset This Graph Window’s Size
- Export Graphics As: Opens the Save Graph Window window and allows for the saving of the graph to various image formats.
- Print: Brings up print preview dialog and prepares for printing of the active graph.
The Edit menu:
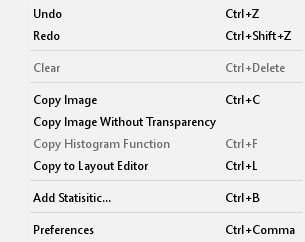
- Undo: Deletes the last action.
- Redo: Adds the last deleted action back to the Graph Window.
- Clear: Deletes the selected gate.
- Copy Image: Converts the active graph into a picture and copies it to the clipboard (no white canvas).
- Copy Image without Transparency: Same as 5 but places a white background behind your image.
- Copy Histogram Function: Converts an active histogram into text and copies it to the clipboard.
- Copy To Layout Editor: Copies the active graph into the Layout Editor.
- Add Statistic: Opens the Add Statistic window and allows for the adding of statistics and parameters to your sample.
- Preferences: Opens the Preferences window and allows for the configuration of FlowJo to your liking.
The Graph menu:
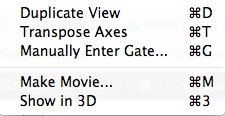
- Duplicate View: Creates a duplicate Graph Window.
- Transpose Axes: Swaps the values of the X and Y axes.
- Manually Enter Gate: Opens the Manual Gate Entry window and allows for the definition of custom gates.
- Make Movie: Opens the Movie Specification window and allows for the conversion of graph data into movie format.
- Show in 3D: Opens the 3D viewer window.
The Display menu:
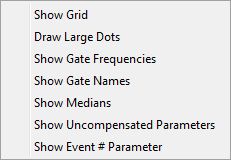
- Show Grid: Toggles a grid overlay in the graph.
- Draw Large Dots: Toggles larger viewable dots when viewing dot plots or outliers.
- Show Gate Frequencies: Toggles the view of gate frequency statistics in the graph.
- Show Gate Names: Displays Gate/Subpopulation name in active graph.
- Show Medians: Toggles the view of gate medians in the graph.
- Show Uncompensated Parameters: Toggles the view of uncompensated parameters in the graph.
- Show Event # Parameter: Toggles the view of the event parameter in the graph.
The Go menu:
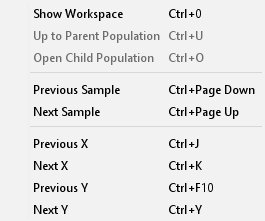
- Show Workspace: Navigates to the Workspace window.
- Up to Parent: Navigates to the graph window of the parent population.
- Open Child Population: Navigates to the graph window of the child population.
- Next Sample: Iterates forward through the available samples in the graph window.
- Previous Sample: Iterates backward through the available samples in the graph window.
- Previous X: Iterates backward through the X axis parameters in the graph window.
- Next X: Iterates forward through the X axis parameters in the graph window.
- Previous Y: Iterates backward through the Y axis parameters in the graph window.
- Next Y: Iterates forward through the Y axis parameters in the graph window.
The Help menu:

Clicking on any of the Help menu options will take you to a web page with help on specific areas of the Graph Window.
Click on a link below to be taken to one of those pages.
