Movies are an ideal way to visualize changes in the fluorescence intensity of various markers or examine the changes in data during acquisition (e.g. by time).
They are also a powerful way to show changes or trends in populations across an entire data set in a compact format. They can be added to any presentation or be made available on the web since the movie is written in an html webpage format.

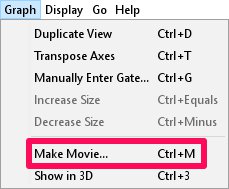
Figure 1. Making a movie from the Graph Window.
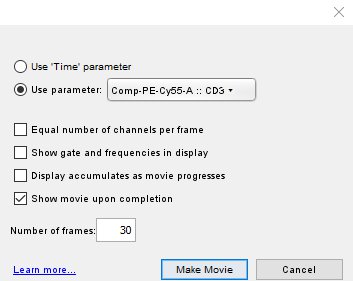
To generate a movie from a graph window select Make Movie from the Graph menu (Figure 1). You will be presented with a window to specify how you would like to create the movie (Figure 2).

Figure 2. The Graph Window Movie Specification Window.
This window presents you with several options:
- Use ‘Time’ parameter: If this is selected, a movie will be generated that divides the events into slices ordered by time so one could “watch” for example, calcium flux over time from a kinetics experiment.
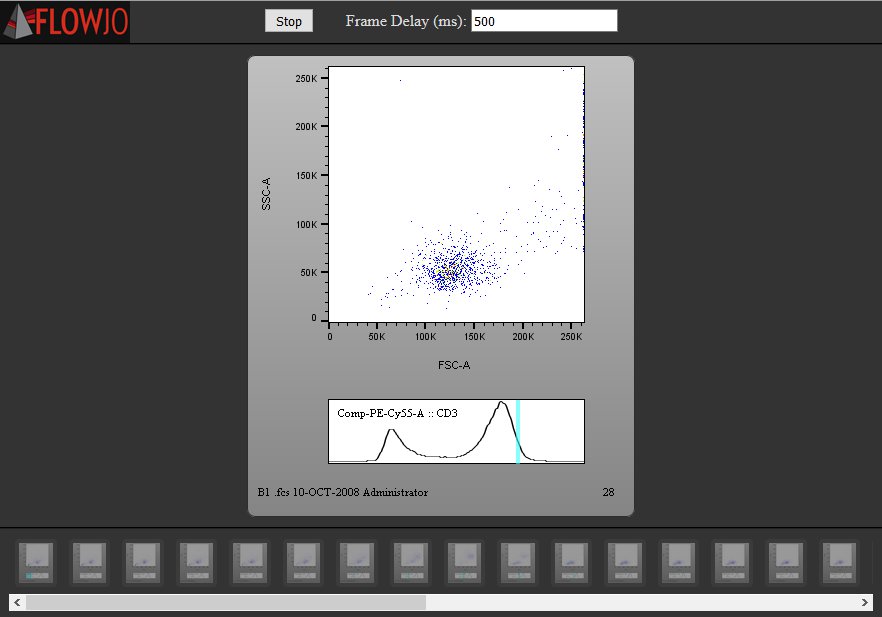
- Use parameter: will generate a movie ordered sequentially across the selected control parameter, which is the third dimension that will be added to the graph (e.g. CD69 in Figure 2). In the generated movie, the control parameter will be drawn in a histogram with a cyan highlighted area over the area that contains the events currently visible in the main (upper) graph.
- Equal number of channels per frame: You can choose whether the slices will be made with an even number of channels per slice, rather than a variable width slice that contains an equal number of events in each slice which is the default.
- Show gate and frequencies in display: If there is a gate in the graph window from which you are generating a movie, this option will display the gate(s) in the movie.
- Display accumulates as movie progresses: For some types of analysis, it is useful to graph events not of each individual slice, but for all of the events up to and including the current slice. The checkbox Display accumulates as movie progresses will cause the graph of each frame to include all of the events with a value for the control parameter of less than or equal to the frame’s current value.
- Show movie upon completion: This will open the movie (html document) in your web browser after the frames and player are generated.
- Number of frames: allows you to specify the number of frames in the movie. The larger the number of frames, the more sensitive it will be to trends that exist within a small range of values.
This will generate a movie player where the graph window parameters can be visualized across the range of the control parameter. A histogram of the control parameter will be drawn as a histogram below the graph and a cyan highlighted area will indicate the events currently visible in the main (upper) graph (Figure 3).

Figure 3. Example Graph Window Movie.
To see an example of this please check out our Graph Window Movie example page, and to learn more about creating movies in the Layout Editor, please see this page.
