In this example, we will use graph window movies to visualize 3 dimensions of data on a subset of cells.
A general overview discussing generating a Graph Window Movie can be found here.
In this example, we will examine whether two murine CD8 T cell costimulatory molecules (CD27 & CD28) are upregulated early after virus infection and if they are upregulated on cells that are expressing a known early activation marker (CD69).
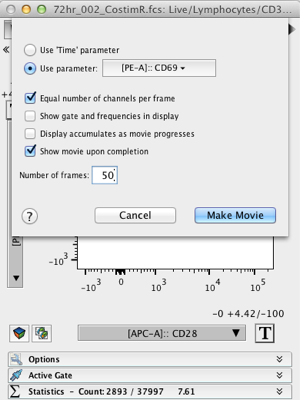
Using Graph Window Movies, we can quickly and easily visualize if costimulatory receptor expression is different on cells expressing varying levels of a known early activation marker. After setting up a gating hierarchy to examine Live, CD8+CD3+ T cells from a virus-infected mouse we opened a graph window of CD27 v. CD28 and will generate a movie to visualize how these two parameters vary by CD69.

Figure 1. Specifying the Graph Window Movie.
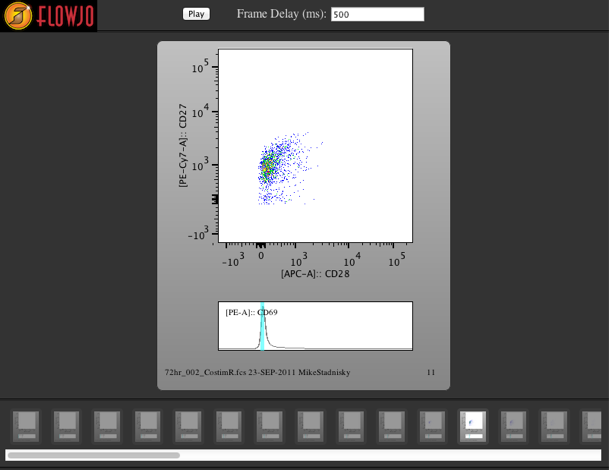
This will generate a movie where the CD27 versus CD28 are visualized across the range of the CD69. A histogram of the CD69 will be drawn as a histogram below the graph and a cyan highlighted area will indicate the events currently visible in the main (upper) graph (Figure 2). The movie can be played to examine the variation in expression of the markers across the range of CD69 expression or individual graphs examined by navigating the frames using the mouse.

Figure 2. Examining the expression of CD27 and CD28 by CD69.
