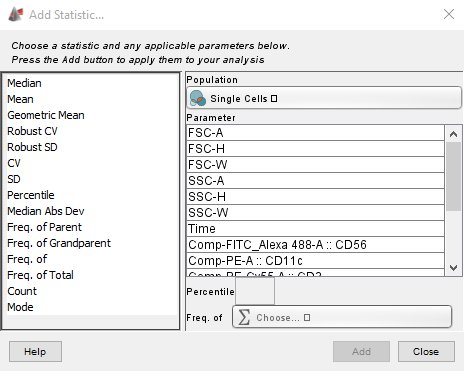
To calculate additional statistical information about your subpopulations, you can add statistics to the subsets.
Select the population, then the Signma button from the workspace tab. The definitions for available statistics are here. Once a statistic has been added to a population, its definition can be copied to any other population or group of samples via drag-and-drop.

From the Graph Window, statistics may be added by selecting “Add Statistic” from the Edit menu, right click menu or from the Add Statistics button at the bottom of the Graph Window.

Once statistics have been added to a node, the easiest way to compute these statistics for other samples or sub-populations is to drag the nodes and drop them onto the desired destination.
Statistic nodes may also be dragged into the Layout Editor to create a text box with the statistic value. Layout statistics are live, meaning that changes to gates will effect change on statistics in layouts.
Statistics are conveniently collected and exported using the Table Editor.
