The experiment annotation platform assists with describing your data and experiment according to the MIFlowCyt standard.
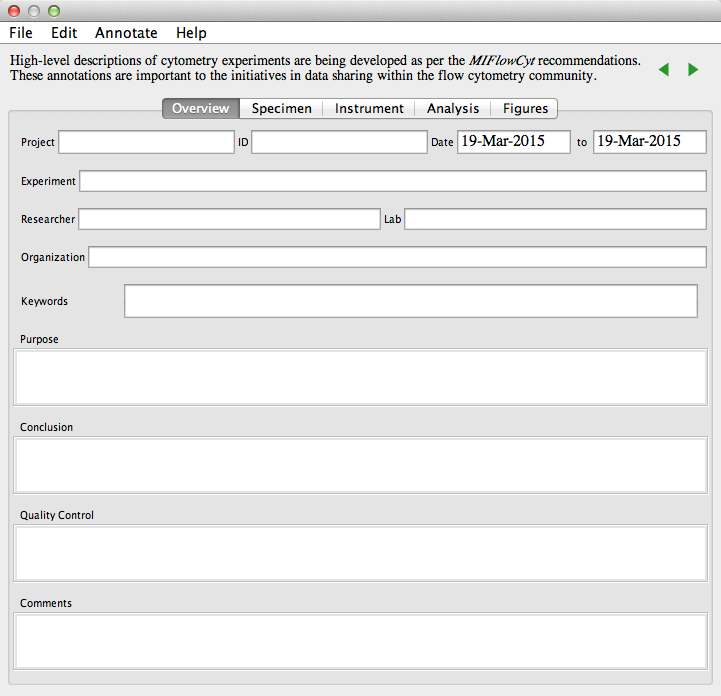
The “Annotate Experiment” tool, which can be found in the the Experiment band, provides a dialog to enter the experimental description.

Figure 1. The Annotate Experiment tool.
This dialog is designed to comply with the proposed Minimum Information about a Flow Cytometry Experiment (MIFlowCyt) standard, and is divided into 5 sections described in further detail below.
Figure 2. The Annotate Experiment tool.
I. Overview: provides high-level project details and a summary of the experiment.
II. Specimen: provides details on the samples and the experimental treatment.
III. Instrument: currently supports the linking to compensation details through sample drag-and-drop.
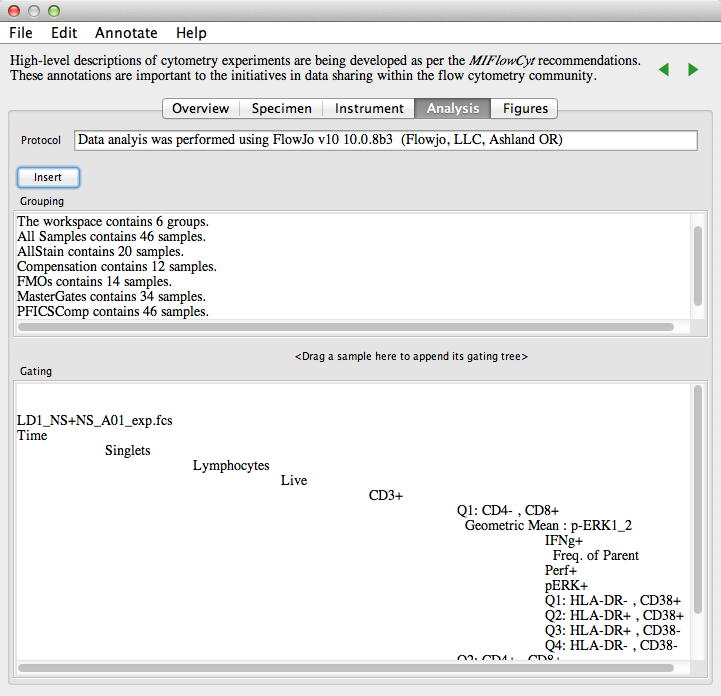
IV. Analysis: provide data analysis details from FlowJo like gating hierarchy, summary statistics, compensation, and transformation. Pressing the “Insert” button will provide a workspace sample groups summary and dragging a sample to “Gating” will provide the gating tree as shown in Figure 3, below.
V. Figures: The graph window has new functionality to “Save as Figure” which will save this the graph to this figure browser.
Figure 3. The Analysis section.
The MIFlowCyt page provides a starting point, complete with a great example that FlowJo structured its MIFlowCyt template from.
A database of research presented published according to the MIFlowCyt standard has been created at FlowRepository.
