The univariate cell cycle platform produces a number of statistics that can be used to summarize the modeling results. This page is under construction; stay tuned for FlowJo Version 10 with Cell Cycle.
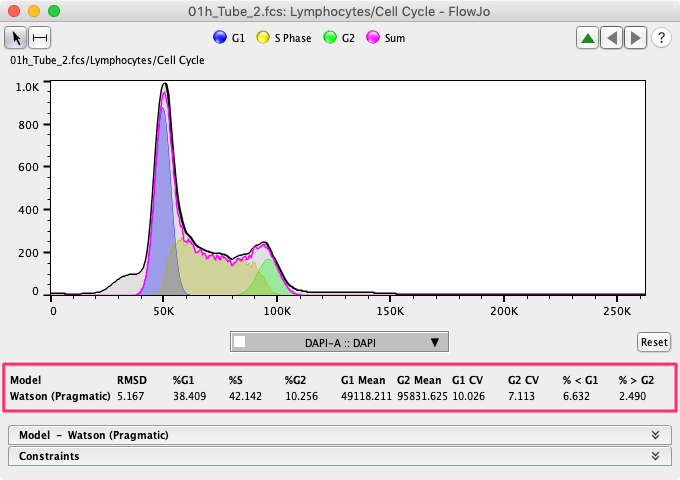
FlowJo univariate Cell Cycle analysis can produce an array of statistics, which are shown in the upper portion of the model window, as displayed in Figure 1.


Figure 1
Means, Coefficients of Variation (CVs), and Percentages
The two main peaks, G0/G1 and G2/M, are modeled as Gaussian distributions and so the mean and the CV can be easily represented by the mean and CV of the Gaussian peaks. For all populations, including sub-G0, and super-G2, FlowJo calculates the percentage of cells in each population, accounting for overlap, by summing the probability of membership in each population for all cells. To create fractions that add up to approximately 100%, a normalization step is required. To preserve the relative relationship between phases we do not simply normalize to 100% but rather map the probabilities to those that sum to 100%. This process can sometimes lead to percentages that add up to a little more or a little less than 100%, or small negative numbers, particularly in the sub-G0/G1 or super G2/M populations. In these cases it is reasonable to think of a population with a negative frequency as simply a very small number of cells.
Root Mean Square Deviation (RMSD)
The Root Mean Square Deviation (RMSD) is the first number in the upper portion of the model window. This statistics is a measure of the ‘goodness’ of the fit of the model to the data. The deviation is the sum of the distances between the model (pink line in Figure 1) and the histogram of the data (black line in Figure 1). A smaller distance, and smaller value for both of these statistics, means a better, tighter fit. That distance is squared and rooted to prevent distances above (positive) and below (negative) the histogram from canceling each other out. Overall this statistic is useful in identifying good applications of constraints, and poor sample fits within an experiment.
Due to variation in experimental procedures and conditions, the RMSD is not useful in comparing results across experiments. If FlowJo fails to fit the model(s) to the data, then it will display “Invalid” in the RMS field.
Creating Gates
When you click the ‘Create Gates’ button, FlowJo will make a series of gates based on the model you have created, and display the resulting populations in the workspace. Whereas the models factor in the overlap of the populations by summing probabilistic membership, the populations created in the workspace do not as FlowJo needs to be able to plot each cell as one dot in a dot plot. To create these populations we are forced to revert to simple Bayesian estimation; i.e. we make the edge of each range gate the point that two distributions intersect.
Exporting the Cell Cycle Statistics
You can drag a cell-cycle node from the Workspace window to the Table Editor to view all of the statistics of the Cell Cycle models in tabular form. Any single statistic can be deleted from the table editor by clicking on it and pressing ‘delete’ on your keyboard as you would with any other statistic that has been dragged and dropped to the table editor.
For more information see the relate links listed below:
