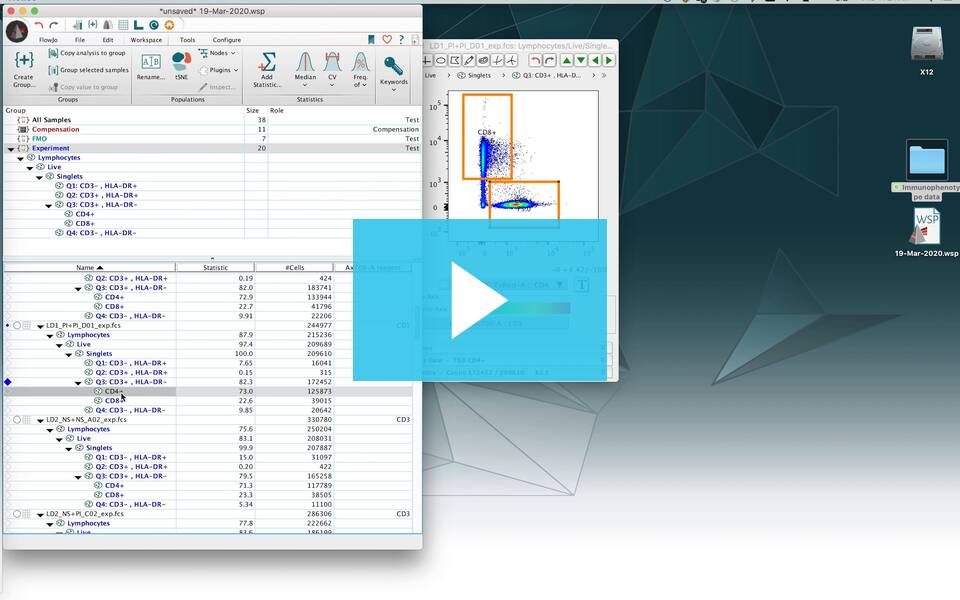
Did you make a gate on one file that you would like to apply to an entire group of files? Just drag and drop the gate to the group, then!
FlowJo is designed to allow the user to analyze entire experiments, as opposed to individual samples. The general plan throughout FlowJo is to define what you want done on a single sample and then apply what you have done to the entire experiment. When creating gates and statistics, these can be applied to Groups. Groups in FlowJo serve to organize samples with similar gating / analysis requirements. They serve as surrogates for all the samples included in a group.
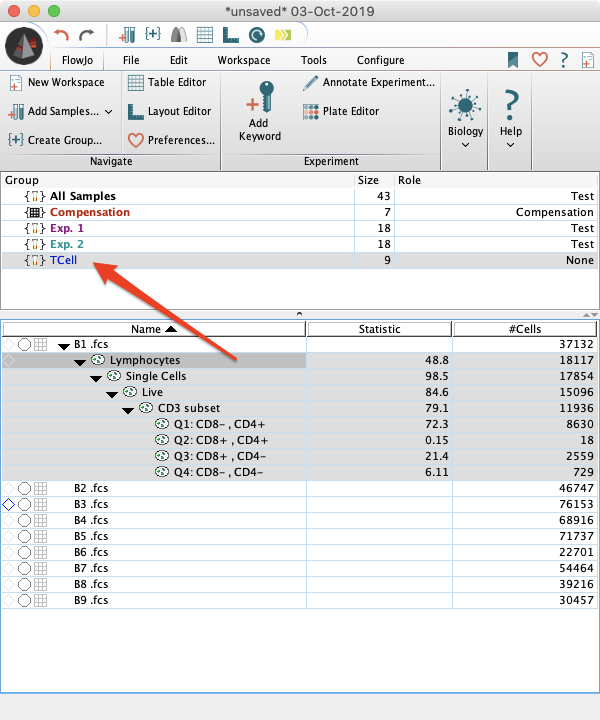
The figure below shows a FlowJo workspace with 9 FCS files in the T-cell group. Follow the link for a description of the FlowJo Workspace. A hierarchy of gates and statistics have been created on Sample B1.
To apply this entire hierarchy of gates and statistics to all 9 files within the T-cell group, simply highlight the entire hierarchy (one can do this by clicking on the top node of the hierarchy, holding down the shift key, and then clicking the bottom node) and drag the selection to the T-cell group.
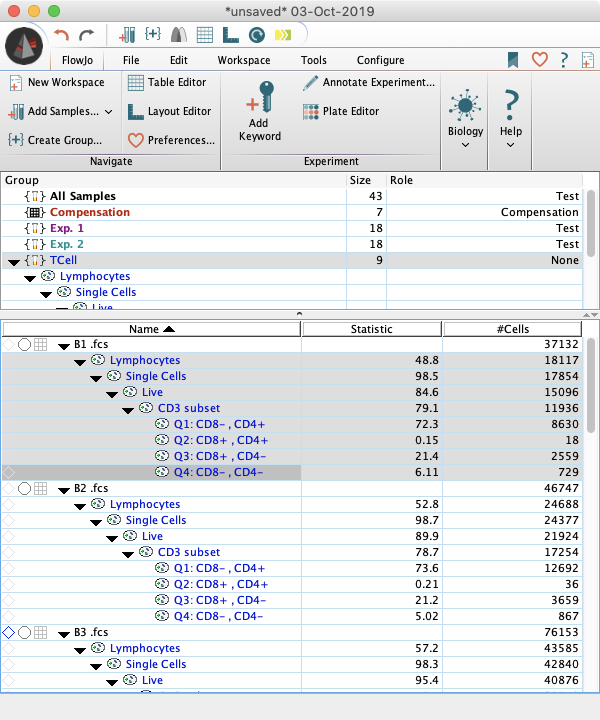
As you can see from the image above, the entire gating structure is applied to every sample in the group. In this example, the analysis tree was only applied to the “T Cells” group. Therefore, only the nine samples in this group have received the analysis tree. The nine samples in the “Monocytes” group did not receive this analysis tree.
The gates and statistics that have been applied to a group become the color of that group, thus indicating they are “group-owned”. Modifications to any gate on any sample can be made and will return the color of the adjusted gate to plain black. This is an indication to you, the user, that a change has been made and that that specific gate is different than the group gate. As an example, the CD3+ gate on Sample B2 has been modified in the figure below.
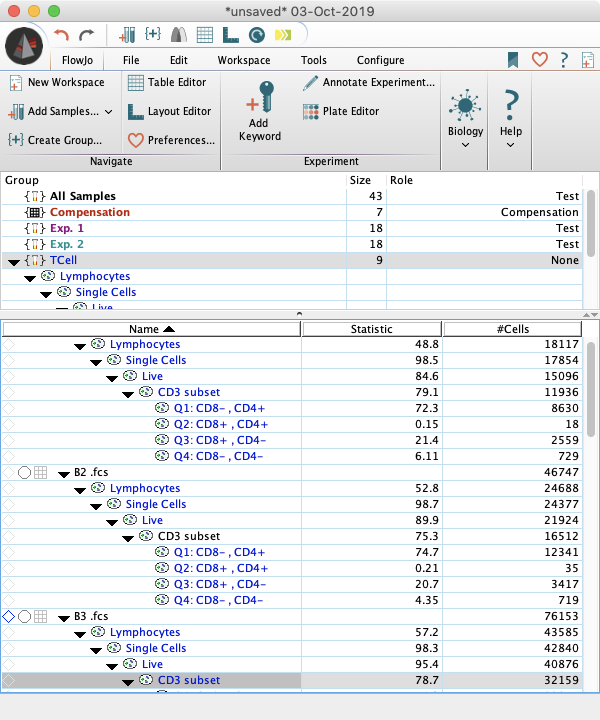
Modified gates can also be reset to the group gate by selecting the modified gate (the black gate) and clicking delete on the keyboard. This will reset the gate location back to the original group gate location.
To apply the modified gate to the group, you can simply drag it and drop it to the population that you would like to apply it to. In the example above, to apply the modified CD3+ gate on Sample B2 to the group, one would drag the modified gate to the ‘live’ gate in the Group panel of the workspace since the CD3+ gate is a child of the ‘live’ gate. If I placed the CD3+ gate at any other level in the group, I would then have two CD3+ gates in my group. Frequently this is the desired behavior. As an example, if you would like to add the median of 2H2 to the CD3+ population you could simply drag it from any sample to the CD3+ gate in the Group panel and it will be applied to all files.
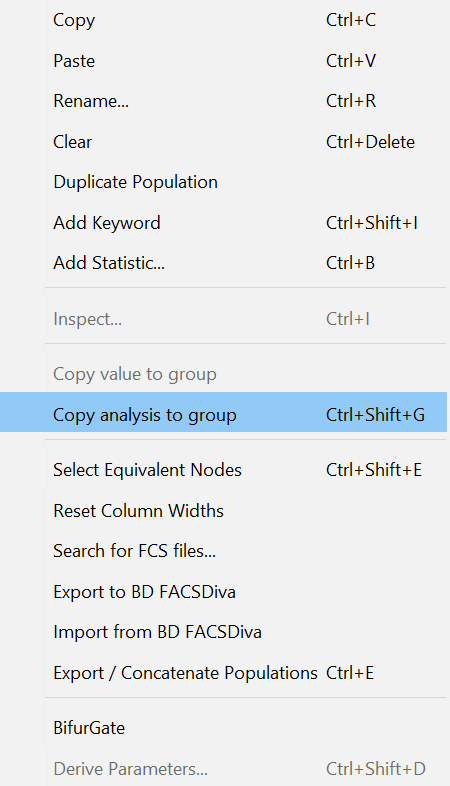
Another way to apply a modified gate to the group, particularly useful when your gating tree is becoming long and “click and drag” may become difficult, is to “right click” on that population and select “Copy analysis to group”
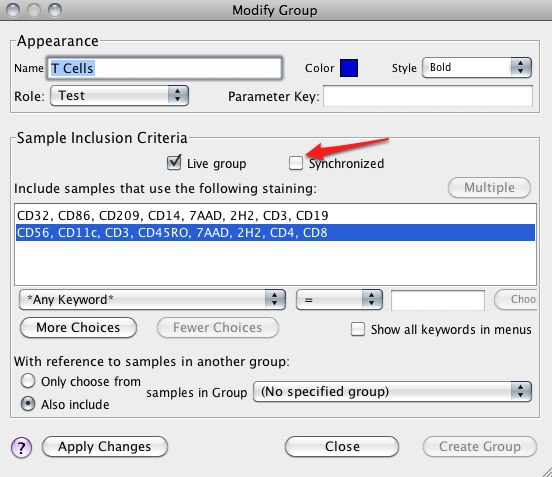
Finally, if you would like for changes made to a gate on one sample to automatically apply to all of the samples in a group, double click on a group in the Group panel and check the box for “Synchronized”, indicated by the arrow in the figure below. This will cause a gate change in any one sample to automatically propagate to every other sample in that group.
Note:
- All adjustments are ‘live’ and update immediately (when the ‘Live’ checkbox is checked in the Modify Group Dialogue above, as on default), so gate changes will also modify any downstream populations or statistics. In the above example, modifying the CD3+ gate in any single sample will also adjust the events contained in the downstream CD4+ and CD8+ populations. The gate positions remain the same (so they will stay the group color), but since the number of events contained in the CD3+ gate have been modified, of course any population downstream will also be modified. The statistics downstream will update to reflect this.

