The Layout Editor’s Grid Tool makes it easy to organize your multi-plot layouts by grouping them into a single table.
You can use grids for keeping graphs aligned and grouped, or you can model 96 well plates by dropping an entire plate of files onto the first cell of the grid.
To create a grid:
Select the grid tool, then click and drag in the main area of the Layout Editor. As you drag, a rectangle will be created that outlines the size of the grid to be created.
The grid will be created with the number of Rows and Columns specified in the Layout panel of your preferences. To edit the dimensions of the grid, right-click it to see the operations drop-down menu shown below.
Choose the option for “Set Grid Dimensions”.
Dimensions in the example below were set to 2×2.
To add plots, stats, text, etc. to your grid, drag-and-drop them from the workspace or from the Layout Editor into the cells of the grid.
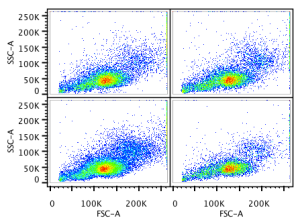
Once you do that, your grid will look like this:

Additional Comments
The fill color will determine the colors used in drawing the background of the cells and the lines in the grid. To set fill color in a graph, drag the graph to the Layout Editor and fill the background using the Fill option in the Object tab.
Note: Graphs you have placed in the grid are drawn on either a white or a black background, and are not affected by changing the fill color. The area under the labels and surrounding the graph is affected by changing the fill color.
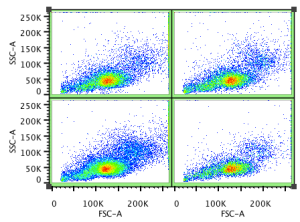
Example showing green fill:

Mouse Click Behavior
If nothing is selected in the layout, then the first click anywhere in the grid will select the entire grid. That is, the grid will render four selection handles around itself:

The selected grid (right) has four selection handles for resizing the whole grid.
The grid also has an active state, triggered by double-clicking:

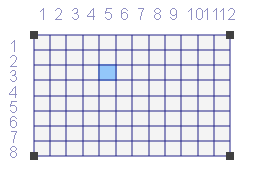
The active grid (right) has four selection handles and row/column labels.
Once in Active state, the individual cells can be activated / selected by single clicks. A selected cell will paint itself darker blue:

Deleting Cells, Rows, & Columns from a Grid
To delete elements of the grid, right-click to get a menu of operations relevant to the grid. You can choose among removing just the currently selected cell contents, or removing the entire row or column that includes the selected cells. You may also remove the contents of a cell from the grid and delete it with the delete key in the usual way.
Showing Axes of Graphs in a Grid
If a grid is used to display multiple samples with the same axes, it is often preferable to suppress the drawing of axes, or to limit it to only those graphs along the left or bottom edge of the grid. Use the right-click menu to set how axes are displayed.
How to use the Grid
1. To make the grid go into edit mode:
- Double-click on the grid; rows/columns will show numbers. Clicking a cell will cause it to highlight blue, indicating it is selected.
2. To pick how many rows/columns the grid should display:
- You can set defaults in Preferences by clicking on the heart icon in the upper right hand corner of the Layout Editor and selecting Layouts.
- Right-click on grid and choose ‘Set Dimensions’.
3. To delete rows/columns from the grid:
- Right-click on row column and select ‘delete row’ or ‘delete column’
- To delete multiple rows/columns, select all desired rows/columns while in edit mode (using shift or ctrl/cmd), then right-click and select ‘Delete Rows’, ‘Delete columns’, or ‘Delete Cells’.
4. Other manipulations:
- Drag samples into a grid cell to create overlays (legends will appear outside the grid). To make the legend appear within the cell, drag the corresponding overlay out of the grid (it will pop up as a regular layout plot), and then back into the grid.
- Select the grid cells, go to the Layout Editor’s Object ribbon band, and set line color to none (top left corner in the color picker).
- You can uncheck ‘Show grid lines’ in the grid’s right-click menu.
- You can set the grid’s cell padding to 0 (via the right-click menu => set cell padding).
- Removing a grid while keeping the contents (they fall back on the canvas of the layout, un-gridded) is accomplished via Right-Clicking a grid, and clicking Remove Cells From Grid.
- “Delete Cell” will remove the row(s) and column(s) of the currently selected cell(s) in order to delete that cell from the grid.
- “Clear Cell” will remove the contents of the selected cell(s).
- Text boxes are now fully editable within grids. To edit a cell, either right-click->Edit Cell or double-click the cell while the grid is already in edit mode.
- To remove an axis from the grid: double click on the graph in the grid to access the graph definition dialog; click on annotation, and check the boxes to remove ticks, numbers, and labels.
- You may place the axis on the outside of border of the grid and remove the axis through the right-click menu.
