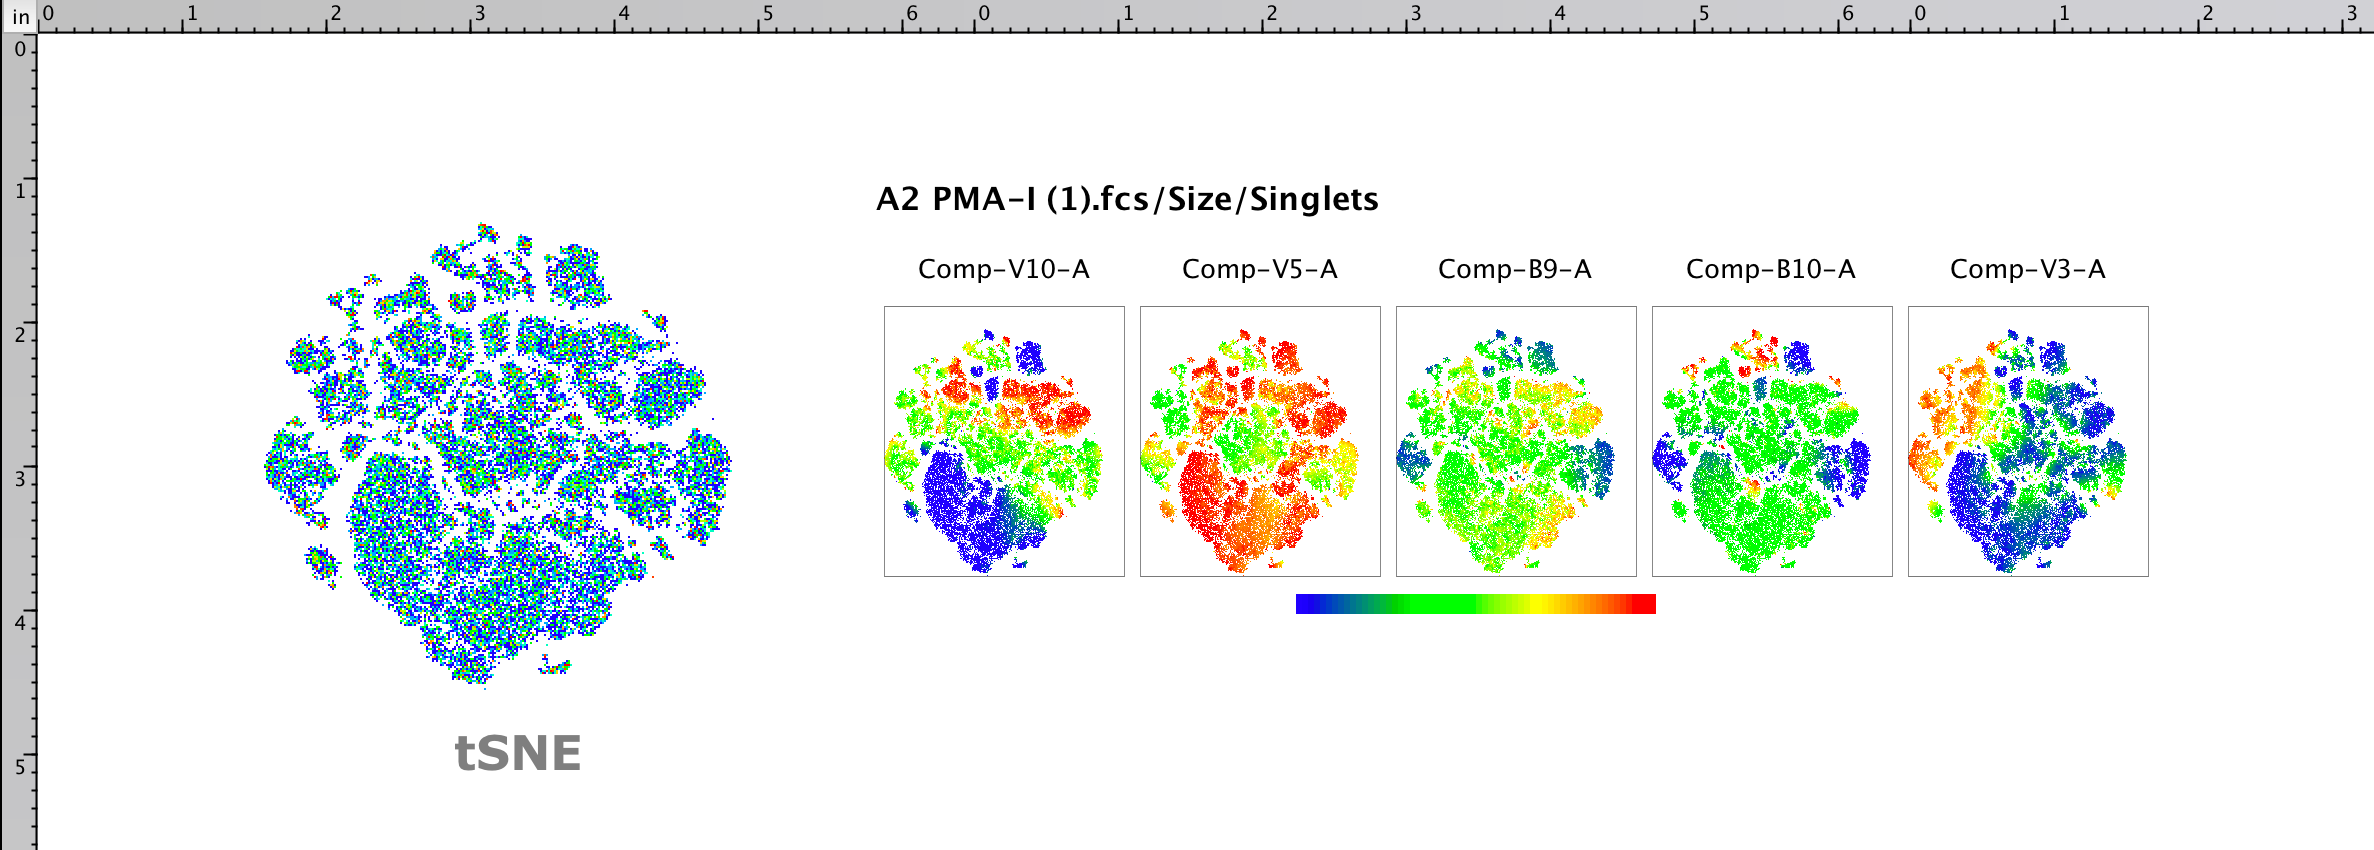
Creating multiple color maps for a single bivariate plot is often useful in analyzing high parameter datasets. This process used to be quite tedious and time consuming – no longer! In FlowJo researchers have the option to create a multigraph color-map in just a few clicks.
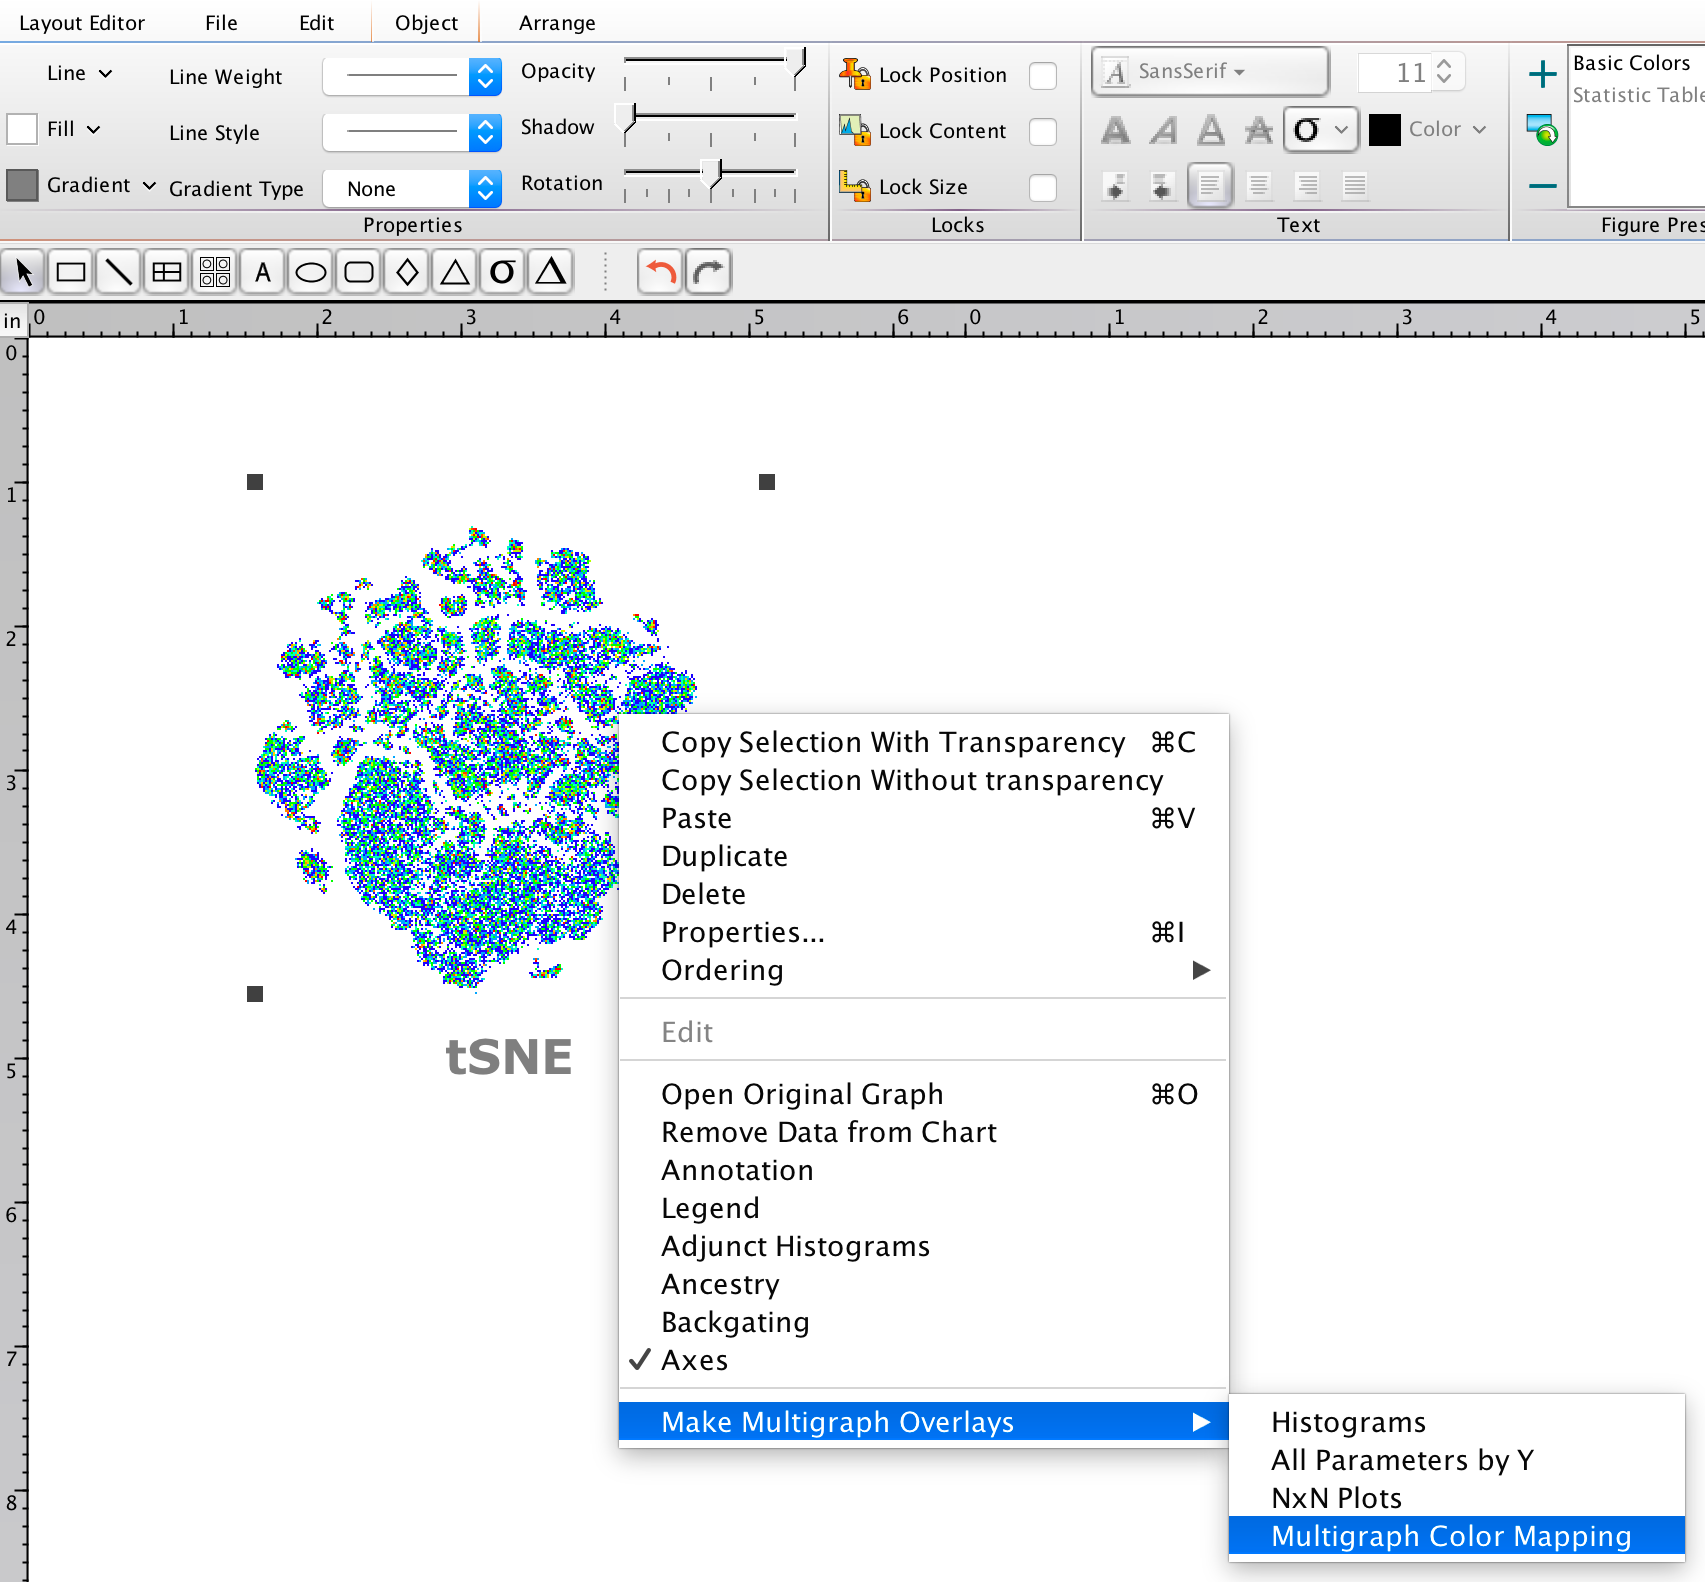
In the Layout Editor, simply right click on a bivariate plot of interest. Under the Make Multigraph Overlays option, choose “Multigraph Color Mapping”.

Note: This option is not available for overlays, because the color-mapping feature is not possible for overlays.
Researchers can then choose any parameters of interest to show color mapped onto the bivariate plot selected.


Note: Color map’s color scaling is calculated based on the range and transform settings for each parameter. These settings may be adjusted for any parameter in the Customize Axis dialog within the T-button next to either axis in FlowJo’s Graph Window.
If you have any questions about dimensionality reduction in FlowJo, or machine learning approaches for data analysis in general, please send your questions to the bioinformatics specialists at: flowjo@bd.com
