Embed is a tool for forward-propagating derived parameters to new data.
Embed can estimate values for derived parameters such as the x and y tSNE values, by identifying the cells that are the ‘nearest neighbors’ in a data set with those parameters, and interpolating values for the new data set, enabling comparison.
Background
Common high-dimensional analysis workflows include creating, or deriving, a set of parameters that represent the cells in a low-dimensional graph by creating a smaller set of parameters (most commonly two) that attempt to ‘summarize’ information from all other parameters. This is known as dimensionality reduction (dim redux), and some of the most common algorithms to do this include tSNE and UMAP. A common follow up step is to use a clustering algorithm to partition the data into like and unalike groups of cells that generally align with phenotypes, and store the cluster membership number as a derived parameter. The primary limitation of these approaches is that these algorithms are non-deterministic; they will produce different results if run multiple times. Cells of the same or similar phenotypes will group together when the algorithm is run, but they will not always be oriented the same, making direct comparison difficult, nor will the same phenotype always be assigned the same cluster number. Traditionally, all of the data to be compared need to be included in the parameter creation step, meaning that it must all be processed at one time. If additional data sets are generated, the entire process needs to be restarted.
Embed allows the user to forward propagate derived parameters from one file to another file or files as long as those files contain some common measured parameters. The algorithm will work best if the data are on the same scale, meaning that background florescence is equivalent and the range of parameter expression is the same. Normalization could be useful to achieve this.
Embed calculation
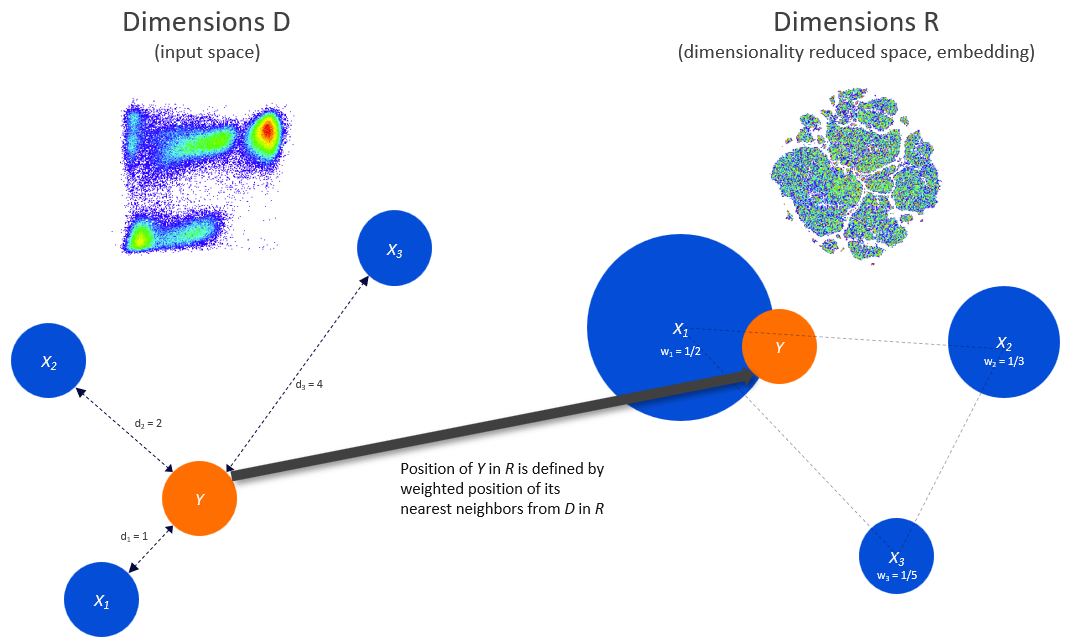
For a data set X for which derived parameters have already been created, and data set Y, that has at least a backbone of matching parameters, for each cell in Y, Embed calculates the k-nearest neighbors within X using selected parameters common to both files, where k is 7 by default and can be adjusted by the user. Nearest neighbors in this application means the cells that are the closest within the measured parameter space with respect to the selected distance metric. Manhattan distance is the default. The cells in X identified as nearest neighbors are then used to create derived parameters for the cells in Y using linear interpolation for continuous variables such as dimensionality reduction parameters. This involves taking a weighted average of the derived parameters in set X. Weighting is performed by the proximity of the given cell to each nearest neighbor.
As an example, if data set X has a parameter set of {CD3, CD4, CD8, CD25, tSNE1, tSNE2} and data set Y has the parameters {CD3, CD4, CD8, and CD25}, we can use the four common parameters, dimensions D in the illustration below, to identify nearest neighbors, then use the subset of nearest neighbor cells to create tSNE1 and tSNE2 parameters, dimensions R in the illustration, for data in set Y.

For clustering parameters which are discrete (i.e meaningful for only specific values) we use a majority voting system to create the new parameter. For example if a cell’s seven nearest neighbors belonged to clusters {1,1,1,1,2,1,3} we would want to assign the cell to cluster 1 as the majority of the neighbors belong to this cluster. For cells who’s nearest neighbors lack a majority cluster, we assign them to cluster -1, an outlier cluster. There is an option to ‘force all cells to be placed in a cluster’ if the users experiment requires all cells to be classified. In that case we will assign the cells to the same cluster as the single nearest neighbor.
Use
On a workspace that contains data both with derived parameters and the files that you would like to embed those parameters to, begin by clicking on the population that contains the parameters and select the Embed tool from the Populations band:

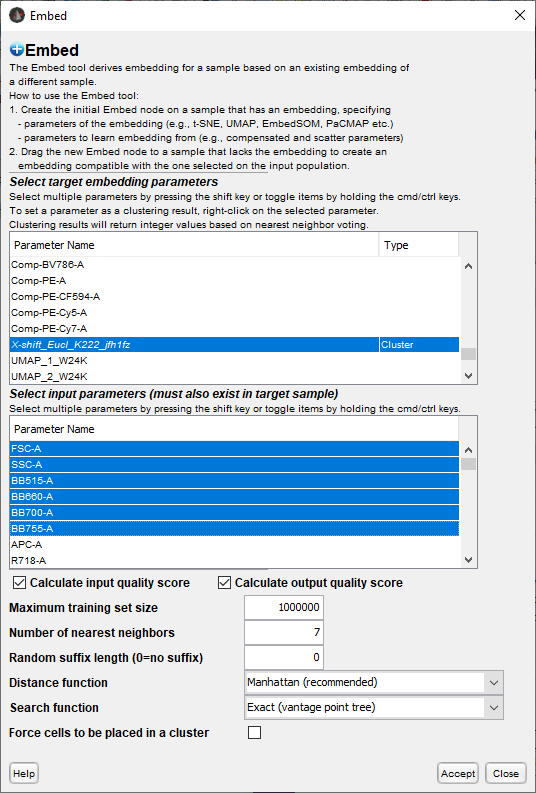
A window will appear in which to specify your conditions:

The top parameter selector allows the user to indicate which derived parameters should be mapped to the next sample. There is a Type indicator that can be used to delineate continuous parameters (e.g. dimensionality reduction) from discrete (i.e. clusters), so that the voting version of the process is used on the latter.
The lower parameter selector allows the user to select which parameters will be used to identify nearest neighbors. The selected parameters from this section must be in both the reference and target file.
Several options are provided to tune your mapping:
- Calculate input/output quality score: The user can choose to calculate two additional derived parameters that can be used to filter the data down to cells that had good embedding results.
- Input quality for a given cell is the average of distance of the nearest neighbors to the cell, normalized by the number of dimensions used. In simple terms, the smaller this number is, the better the nearest neighbors represent the target cell.
- Output quality for a given cell is the average normalized distance between the nearest neighbor cells in the embedded parameter space. Smaller numbers are better. A large number could indicate that nearest neighbors in the measured parameter space have been significantly separated in the dim redux space (e.g. tSNE splitting homogeneous populations into separate islands).
- Maximum training size caps the search area for detecting nearest neighbors, essentially downsampling to the entered number before finding nearest neighbors.
- Number of nearest neighbors gives the user control over how many cells are included in the target cells neighborhood. A larger number lowers the impact of any one cell creating a more robust result. Too large a number, however, will water down the quality of the result by factoring in less similar neighbors. Seven is the default.
- Random suffix allows the user to annotate parameters that were all part of the same run.
- Distance function allows the user a variety of ways to calculate distance and assess ‘nearest’. The options are Manhattan, Euclidean or Chebyshev.
- Search function is the method for finding the nearest neighbors. The options are vantage point tree, kd tree, and brute force.
- Force cells to be placed in a cluster forces the embedding to assign every cell to a cluster when embedding clustering parameters, even cells that have no majority in cluster voting.
Once you accept a set of choices, the algorithm will calculate and produce an Embed node on the reference sample, and when complete will say ‘Ready to drag to a target sample’. The user can simply drag this node to a population at either the sample or group level, and the chosen derived parameters will be calculated.
Reference
Coming soon – Patent pending
