Marker Enrichment Modeling (MEM) is a quantitative naming system for populations. It provides a way to automatically give non-heuristic names to discovered populations.
MEM is a tool devised in the Irish Lab at Vanderbilt University by a team led by Kirsten Diggens. For a complete discussion on the methods, please see the publication Characterizing cell subsets using Marker Enrichment Modeling. This document will focus on the overall concept and use in FlowJo.
Background
Typically, clustering results are a middle step in the process of understanding interesting phenotypes within an experiment. Data are cleaned up, clustered, and perhaps compared versus a control. The experimenter may notice clusters that are over or under represented in the experimental files compared to control. However, significant work can remain to identify the phenotype of clusters of interest, and how similar those cells are to other clusters within the sample, within the control sample, or within another experiment. This can be done via many methods of inspection, but the result is typically a relatively heuristic population name. The main issues with heuristic names, i.e. ‘memory t-cells’, is that (1) they do not capture all of the information available for a population identified with a larger panel (2) not everyone agrees on exactly what expression level of what parameters define a name (3) it does not lend itself to further algorithmic analysis.
MEM approach
Using MEM, populations can be named qualitatively by listing and scoring each marker that is enriched compared to some reference population on a scale of 1-10, then ordering the name from most enriched to least. The equation for a MEM score per parameter is:

Where MAG refers to a measure of magnitude, for which FlowJo uses median fluorescent expression, IQR is the interquartile range, POP is the population being evaluated, and REF is a reference population the experimenter can select. This raw MEM score is then normalized to a 1-10 score by dividing all scores by the highest absolute value MEM score observed across all markers and populations, then multiplying through by 10. The +/- sign is added afterwards to indicate whether the reference or experimental population were brighter.
The experimenter can then set a threshold for how large a MEM value must be to remain included in the population name.
Example
In this example we have clustered a data set.
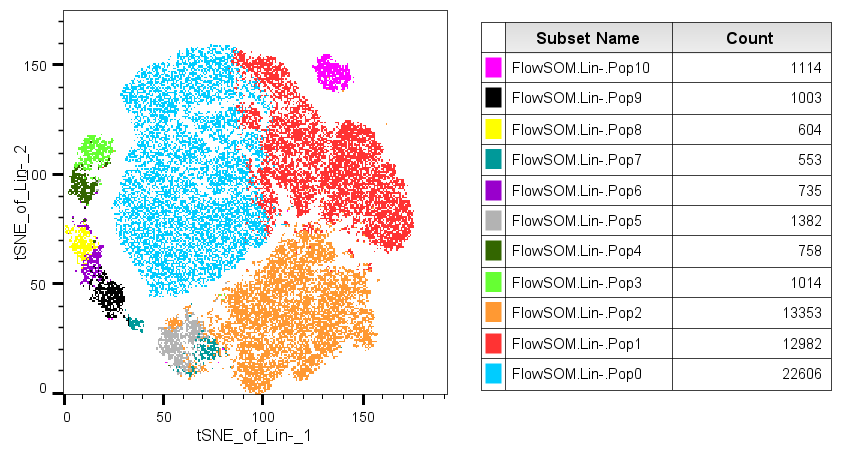
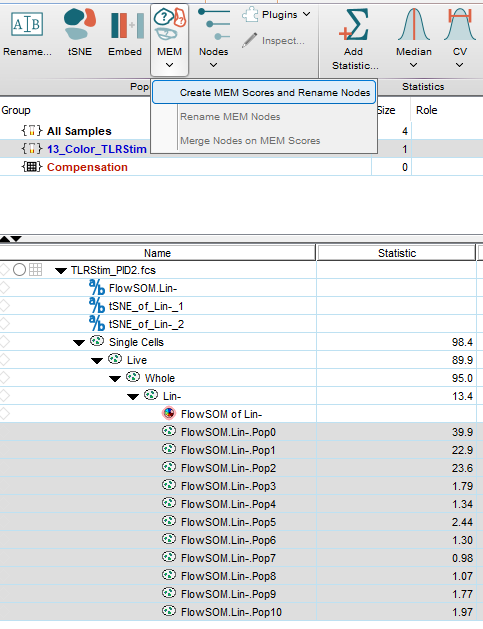
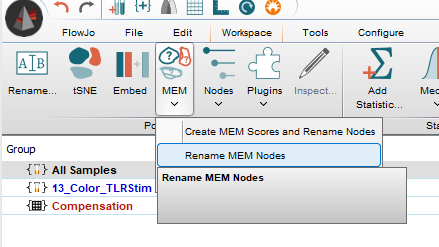
The populations have been given random cluster names. To use MEM, select all of the populations, and from the Workspace Ribbon (by default) and the MEM dropdown, select the Create MEM Score and Rename nodes option:
The MEM user interface will appear. The required user inputs are the parameters of interest, what to use as a reference population, and the threshold setting for which parameters to use in the MEM names.
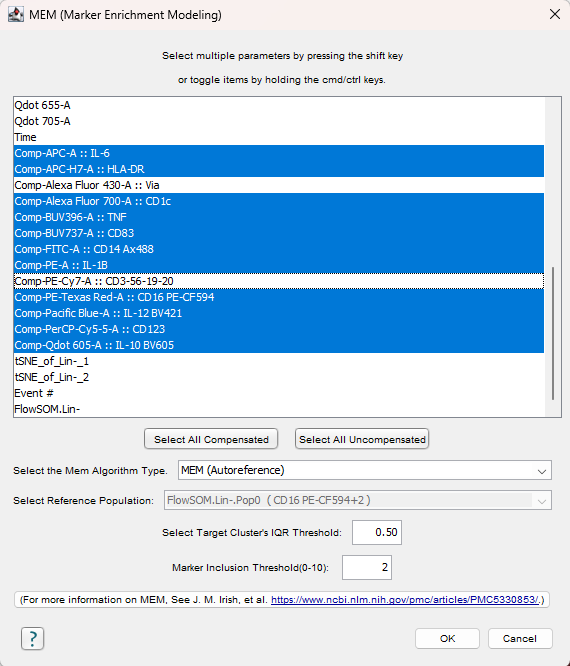
MEM Algorithm type – There are three options for algorithm type:
- Autoreference – For a set of selected populations, the reference population will be the combination of all populations other than the one being scored. For example, for a clustering result with clusters 1-5, the reference population for cluster 1 will be clusters 2-5. For cluster 2 the reference population will be cluster 1 combined with clusters 3-5, and so on. This choice will make sense for most exploratory workflows where the question the experimenter may be looking to answer is ‘what makes this cluster different from the other clusters?’.
- User defined reference – If the question the experimenter is attempting to answer is ‘what makes each of these clusters different from some specific population?’, perhaps a negative control of some kind, then a user-defined reference will be appropriate. The Select Reference Population box will ungray when this choice is made, allowing the user to pick one of the other populations present on the current sample.
- Referenceless – This options allows the experimenter to abstain from using a specific reference and simply uses the range of the data space.
Select target Cluster’s IQR Threshold: The MEM equation includes a ratio of IQRREF / IQRPOP. The IQR threshold sets the minimum value for this ratio, preventing a very small number in the denominator of this ratio from pushing this value toward infinity. If the target population’s IQR is less than 0.5, we simply use 0.5 instead.
Marker Inclusion Thresholds: This threshold designates the magnitude of a MEM score for inclusion in the naming. For example, if a cluster had produced a MEM score of CD3+5 and CD8+2, with a threshold set at 3, the cluster would be named CD3+5.
The output in our example looks like this:

These results indicate that most of the clusters had one or two parameters that stood out as expressed somewhat higher than the rest of the data, with the specific marker or two listed in the name, and clusters 6, 8, and 9 were particularly bright for a few markers. There were a few clusters whose expression levels were unexceptional for all markers. We can confirm this by heatmapping a few notable parameters vs. our clusters:
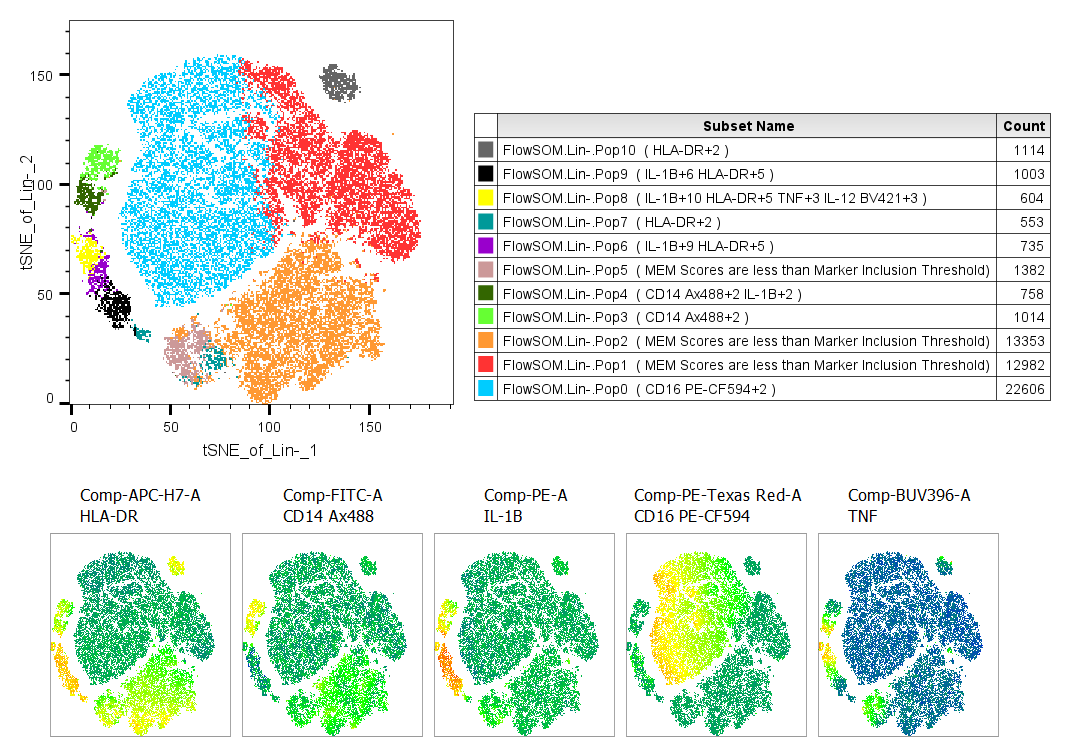
We can observe that the blue population only has differential expression for CD16 looking at the heatmaps, and the MEM score agrees, the population name is based only on CD16. The small populations on the left of the tSNE plot each express 2-4 markers differentially, and the names reflect that.
Post MEM score creation, Rename MEM Nodes allows the user to apply a new threshold for parameter inclusion and rename the populations accordingly. So it is easy to explore what changing the threshold does to simplify population names or add information.
Merging Clusters
MEM scores allow for quantitative comparison of clusters. The option Merge Nodes on MEM Scores allows the user to set a threshold for combining clusters. The threshold is the magnitude of the difference between two clusters for any parameter. If this difference exceeds the threshold value, the clusters will not be merged.
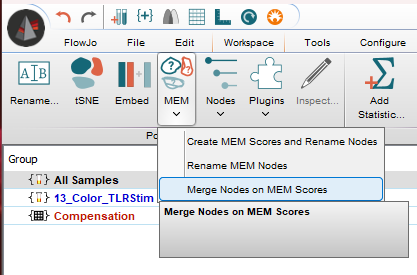

For example, if two clusters have MEM scores of:
- CD16+3 IL-1B+2 HLA-DR+2
- CD16+3 IL-1B+1 HLA-DR+1
The largest difference is 1. Using this tool with a threshold of 1 would cause these clusters to be combined. A threshold of 0 would keep them separate. It is worth noting that because MEM scores range from 0-10 and the fluorescence data is typically binned to a 1-262,144 scale, a MEM value will still contain a range of data values. While setting a merge threshold to 0 might sound useless, in fact it can combine clusters that clustering algorithms have separated based on some minimal difference that are not biologically relevant. Importantly, FlowJo maintains all of the original clusters and creates new populations using Booleans gates for the merged clusters, so there is no risk of loosing clustering results by trying this.
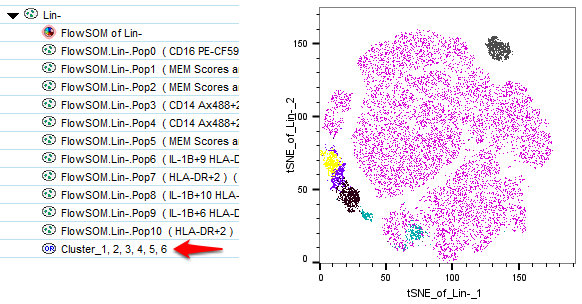
In the above example, setting the threshold to 1 results in the merging of clusters 0-5, essentially all of the clusters that had MEM scores that only reached a maximum value of +2, while expressing enough of the target to have a minimum value of +1.
NOTE: Cluster merging in FlowJo counts the clusters by position, meaning it counts from 1 upward. Some clustering algorithms, including FlowSOM as visible in this example, begin counting cluster numbers from 0 which can cause a numbering discrepancy.
References
- Characterizing cell subsets in heterogeneous tissues using marker enrichment modeling. K. E. Diggins, A. R. Greenplate, N. Leelatian, C. E. Wogsland, and J. M. Irish. Nat Methods. 2017 March ; 14(3): 275–278. doi:10.1038/nmeth.4149
