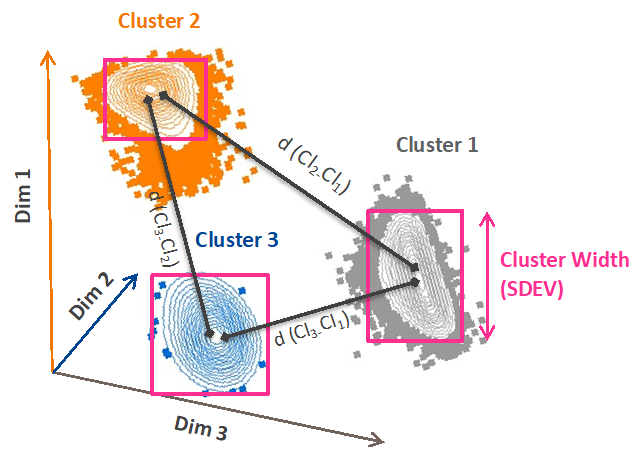
Taylor Index is a metric primarily for evaluating the goodness of clustering algorithms in n-dimensional space.
The Taylor Index is a metric used in the Euclid plugin for evaluating the goodness of a clustering result based on the relative separation of the individual clusters versus their compactness. It is the ration of the distances between cells in a cluster to the distance between clusters.
The Taylor Score is a weighted summation of all Taylor Indices associated with a full set of clustering results.
Background
The Taylor Index provides information concerning the similarity or dissimilarity of two clusters based on their phenotypic expression across a n-dimensional space. The algorithm calculates the similarity of the cells within a cluster using robust standard deviation, the cluster position by n-dimensional mean, and the distance of paired clusters in the n-dimensional space using the distance metrics Euclidean distance. The final score, calculated on a per cluster pair basis is the ratio of intra-cluster distance to inter-cluster distance. The Euclid plugin illustrates the results on a heatmap.
Taylor Index Calculations
- Intra-cluster calculations: The Taylor Index first calculates the compactness of each cluster, the intra-cluster distance, by robust standard deviation. The smaller the distance between the cells within a cluster, the more tightly packed they are, the more likely they are to be phenotypically alike, as the numbers used to calculate ‘distance’ are the intensity values of the selected parameters.
- Inter-cluster calculations: The inter-cluster distances are also calculated by Euclidean distance in n-dimensional space. The equation for this is:


- Taylor Index calculation: The ratio between the Euclidean distance (inter-cluster distance) to the sum of the robust standard deviation (intra-cluster distance) of the clusters across the n-dimensional space, represents the Taylor Index. The calculation of the Taylor Index is performed for all pairs of clusters in the given dataset and selected clustering method.

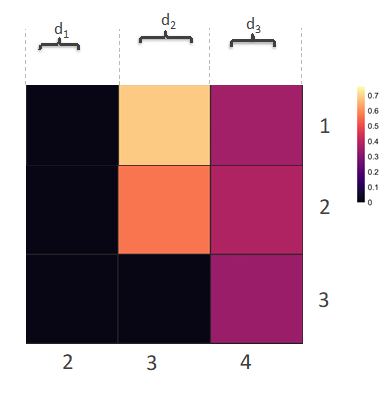
- Heatmap creation: Taylor Index values are then visualized on a heatmap. Smaller values indicate a poor clustering outcome; either small distances between two clusters and/or large spread within at least one cluster. Larger values indicate better clustering; either well separated clusters and /or tight, compact clusters. The color range in the heatmap is darker colors for smaller, worse separation between a pair of clusters to hotter colors culminating in yellow for well separated, compact clusters. In the example below, each row and column represent a cluster number. The intersection is the Taylor Index for those two clusters. In this example clusters 1 and 3 are the best resolved from each other, and cluster 2 resolves poorly from all other clusters.

Taylor Score Calculations
The Taylor Score is the weighted summation of all Taylor indices for a clustering outcome.
- Weighting: Clusters with more cells are less likely to be a set of outliers, and simpler cluster definitions are a good indicator that over-clustering has been avoided. Hence, we calculate the weights on Taylor indices as:

- Taylor Score: The overall score is then calculated as the log of the sum of the indices calculated on pairs of clusters, multiplied by the weight.

Recommendations
- Taylor Index / Score could also be used to evaluate the goodness of dimensionality reduction approaches when used in combination with a consistent clustering approach.
- Appropriate scaling for all parameters is recommended prior to running Euclid. FlowJo uses binned values for calculations, thus scaling will factor into the outcome.
- Manual validation is suggested to examine the data for under clustering.
- Euclid should automatically install its own dependencies; however if you need to manually install R packages, the required packages are: devtools, tidyverse, clustRcheck, dplyr, tidyr, ggplot2, viridisLite, ggnewscale, ggfittext.
If you have additional questions don’t hesitate to reach out: flowjo@bd.com
