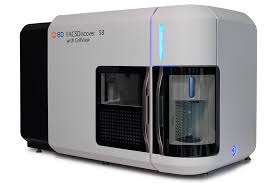
The BD FACSDiscoverTM S8 Cell Sorter is a new cytometer with a wide range of capabilities that result in unique data.
The BD FACSDiscoverTM S8 is a high-dimensional spectral imaging sorter with a high dynamic range, so processing the data involves unique scaling settings, proper spectral unmixing, the ability to analyze images, and integration with the suite of high-dimensional analysis tools that make computation sorting possible.
Derived imaging parameters
The instrument has 78 fluorescence detectors, 3 dedicated imaging detectors, and additionally derives 12 image metrics for each of the 3 imaging parameters. The derived parameters are:
| Parameter | Description |
| Center of mass (X and Y direction) | Position of the center of the parameters signal, weighted by both distance and intensity. |
| Correlation | Measure of the similarity of expression spatially of two parameters |
| Delta center of mass | Distance from the center of mass from one parameter to another |
| Diffusivity | Measure of the concentration of a parameters intensity |
| Eccentricity | Measure of how round a parameter is |
| Radial moment | Average distance of the pixels from the centroid for a parameter |
| Size | Pixel coverage of a parameter |
| Total intensity | Integration of all intensity values of all pixels for a parameter |
To help illustrate what some of the more interesting derived parameters mean, and how they can be thought of to help identify cells of interest, Figure 1 shows a cartoon of the feature and what images look like from low / medium / high intensity values.


Figure 1: Illustration of derived imaging parameters
Scaling
Scaling is critically important for proper analysis of single cell data, and more intricate for data from the BD FACSDiscover S8 because the instrument has a seven decade range, and the derived image parameters each have a unique scale that differs from the fluorescent parameters. We highly recommend setting individual parameter scaling preferences using the Advance Parameter Scaling Tool.
Additionally, please see our recommendations for the BD FACSDiscover S8 specifically.
Spectral Unmixing
Spectral unmixing of BD FACSDiscover S8 data can be done on the instrument itself or performed in FlowJo using the single stain controls. Support for modifying a matrix is currently limited. Please see our recommendations for Unmixing BD FACSDiscover S8 data.
Image Analysis
Image analysis in FlowJo is done using the BD CellView Lens plugin. The plugin can be downloaded from the FlowJo Exchange and requires no additional software for all standard analysis. We highly recommend using the BD Research Cloud for storing image data, extracting the images, and linking the images to the BD CellView Lens plugin in FlowJo for analysis. It is free to create a BD RC essentials organization for up to 10 users and 50 GB of storage.
Computational sorting
Populations of interesting cells can be identified in many ways in FlowJo, and this is particularly true for data with images. Images can be used to identify populations in ways that are not directly compatible with sorting. Examples of this include visually identifying cells of interest then using the Find Similar Images tool in the BD Cellview Lens plugin to find similar cells, or performing clustering using image derived parameters among the inputs.
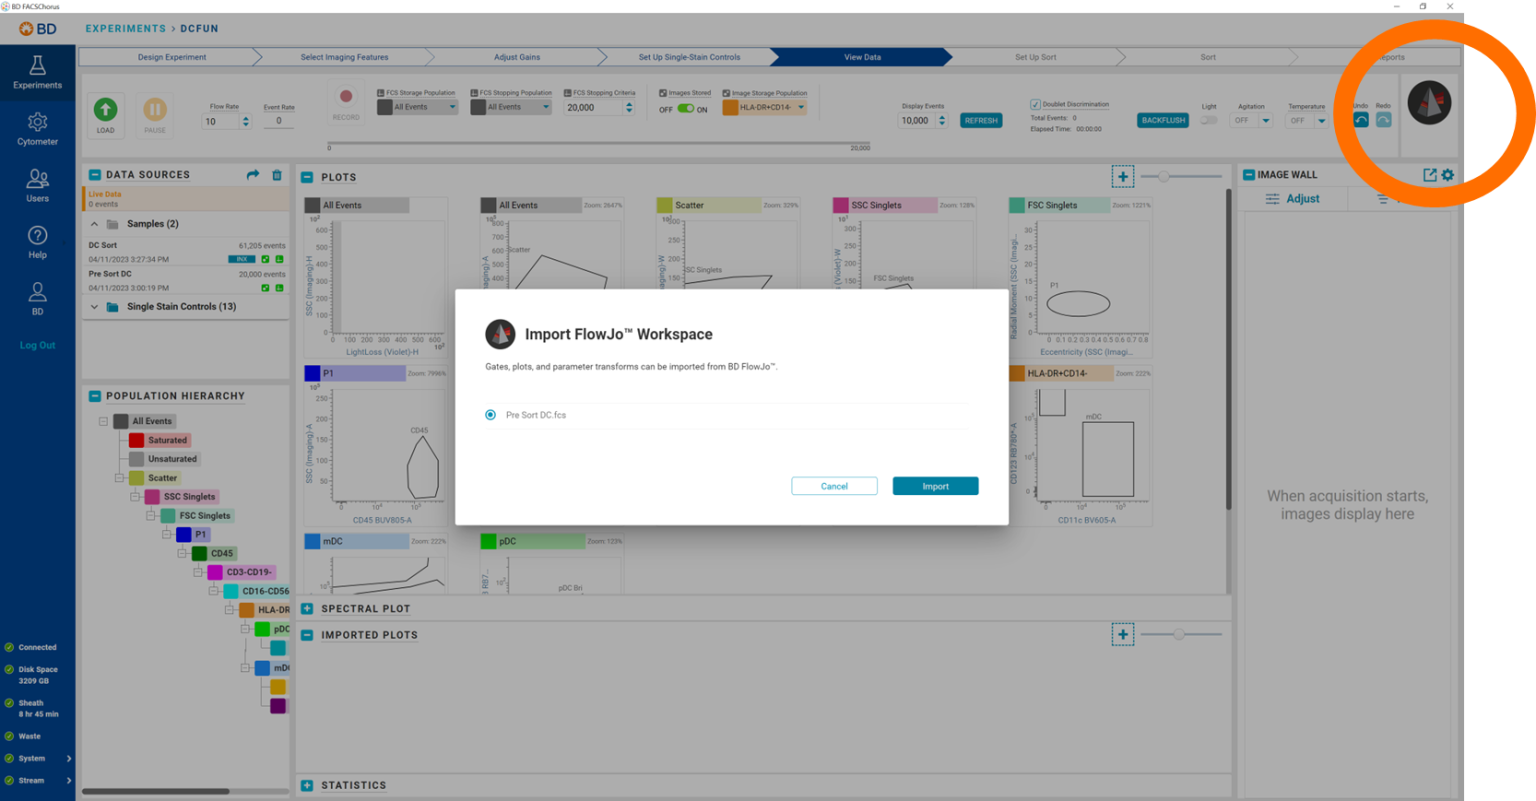
The Hyperfinder algorithm can be used to recapitulate populations of interesting cells by creating a series of gates that match the input population. The HyFi gates (gates produced by Hyperfinder) can be imported into BD FACSChorus software simply by opening the FlowJo workspace with these gates. You can then sort to find more of your interesting cells or validate.

Figure 2: Illustration of the Import from FlowJo tool in BD FACSChorus
Search Function
Finally, a small usability recommendation. The search tool in the parameter list becomes of paramount importance with these data. Typing in one of the image parameters (or alternatively one of the target antigen labels or specific parameter names), will limit the displayed parameters to those that partially match the search criteria. The example images below depict parameter lists after searching for either all of the light loss measurements (LightL), returning 16 imaging derived measurements, or searching for CD123, returning the 16 image derived measurements of CD123 and the one florescent measure.


