Working with images? You can open, gate, and add statistics to image files with the latest release of FlowJo v10 (10.0.7 or later).
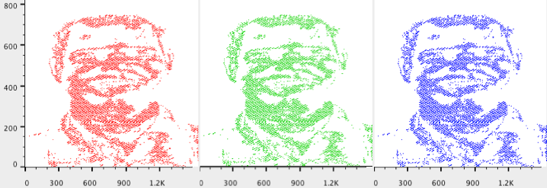
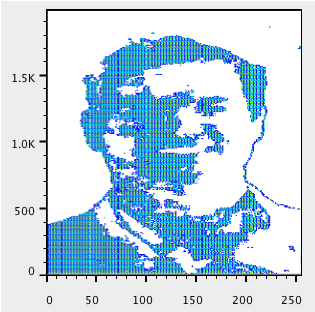
Image files, like FCS files, can be parsed into component parts for analysis. Similar to events or cells in an FCS file, pixels are characterized by their color and brightness attributes. In this case pixels are treated like events; gates can be created on regions of interest (e.g. GFP+ areas), MFI’s (median fluorescence intensity) and other statistics can be added, and reports can be generated via the Table and Layout Editors to display results across samples or experiments.
Beyond analysis of individual image files, FlowJo v10’s image analysis power can be applied to meta-analysis. That is, grouping images based on specific characteristics (e.g. images that have high expression of a particular tag, antigen, or protein). This is particularly useful for high throughput applications or when you have several images from an experiment and need to quickly pinpoint which files contain images and have a pixel hue or saturation above a specified threshold.
Accepted Image file types
Currently FlowJo v10 will open JPEG, PNG, BMP, and GIF images. Many laboratory instruments will save imaging data as a proprietary file type, or as TIFFs. TIFF, PDF, and other image file types must first be converted to an accepted format before opening them in the FlowJo workspace. Fortunately, there is a plethora of image software available to interconvert almost any file type (e.g. ImageJ, Adobe Photoshop, Macintosh’s Preview App, etc).
Opening an Image File.
The following steps will guide you through opening an Image file in FlowJo v10.
1. Open a new workspace in FlowJo v10 (10.0.7 or later).
2. Open the Finder or Explorer window to find the image file of interest.
3. Select the image file (JPEG, GIF, BMP, or PNG) and drag it to the workspace.
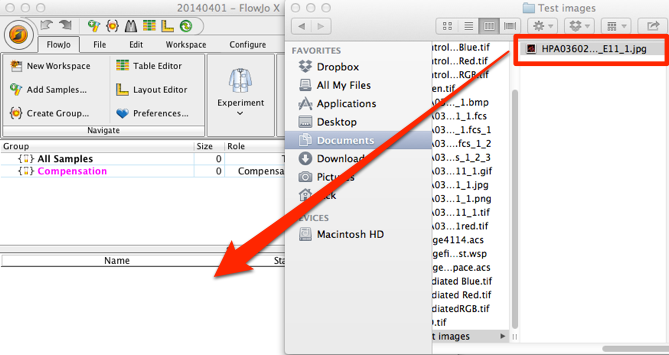 4. FlowJo will convert the image file to an FCS file, and should appear in the Finder/ Explorer window as well as the Workspace. Depending on the size of the image and your system’s power, it may take a few seconds to appear.
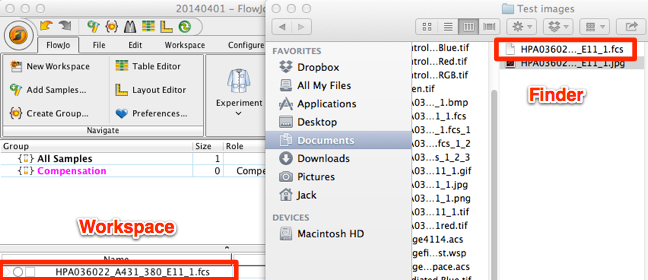
5. Double click the image to begin analysis of your image. Note: for large images, you may want to export the image as an FCS3 file and reduce the number of “events” by an order of magnitude or two. For more information on exporting files, click here.
Image File Contents
In order to open an image in FlowJo , it first must be converted to an FCS file. FlowJo contains a “Text to FCS” library that will convert various file types to an FCS file. The nascent FCS file will then appear in the workspace. After it is created it can be dragged into the workspace and viewed in the same manner as any other FCS file. It is important to note however, that the image file and the newly synthesized FCS file must be dragged into the workspace from the Finder/Explorer window. Using the Open command will not permit conversion of the image to FCS, nor will it open the generated FCS file. Refer to the section above for a detailed description of how to open an image file in FlowJo .
FlowJo converts the image file to an FCS file that contains 32 keywords, 16 of which are the parameters (8) and their associated stain names (8). In addition, FlowJo rotates the image axes by 90° counter-clockwise. For a detailed description of keywords contained within FCS files, click here. The bulk of this section will be dedicated to discussing the parameter (and associated stain) names.
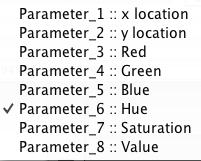
The 8 parameters contained within the synthesized FCS file encompass a pixel’s set of values; its location on a cartesian grid and its values as expressed on an RGB cube and a color wheel (or more accurately, a 3- dimensional color cone).
The location parameters.
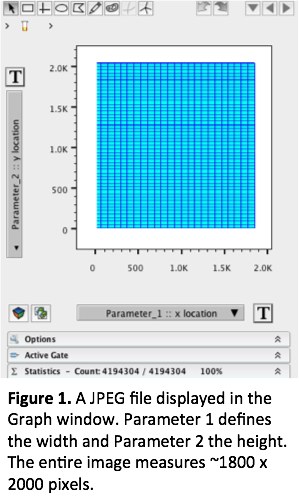
The first two parameters essentially define the size of the image. By looking at both of these parameters simultaneously you can describe your image as being “X” pixels wide by “Y” pixels tall. In the following example, the image is approximately 1800 pixels wide x 2000 pixels tall (see Fig 1.). On occasion you may have to adjust the scale to fit image in its entirety within the graph window. Simply press the “T” button and add a few positive and/or negative decades. If you are working with images of the same size, you may want to consider saving the image scaling for other files you intend to bring in, that way you won’t have to rescale them every time.
The color parameters
Parameters 3-5 define the pixels’ intensities for each one of the color channels (Red, Green, Blue- RGB). These can be thought of as parameters that measure absolute intensity of the specified color. The RGB parameters are fairly straightforward and can be used to answer basic questions like “How much blue does this pixel have?” or “Which pixels contain X amount of blue?”
Parameters 6-8 are significantly less intuitive and correspond to dimensions of a hexcone color cylinder (HSV). This model breaks down the 3 dimensional color cone into three distinct dimensions corresponding to hue, saturation, and value.

Hue
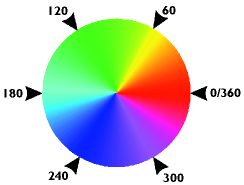
Remember the acronym ROY-G-BIV? The visible spectrum is generally depicted on a linear scale from low to high energy, and with the progression of colors red, orange, yellow, green, blue, indigo, and violet. The hue parameter (6) wraps this linear scale into a circle. The scale of this parameter is expressed in degrees (°). 0-45° represents red, 45-90° orange and yellow, 90-170° green, 170-190° cyan (red’s compliment), 190-260° blue, 260-350° indigo and violet and finally 350-360° come back to red.
Saturation and Value
Saturation and Value (parameters 7 and 8, respectively) are much less intuitive and controversial descriptors of chromatic properties. Saturation defines the degree of white or dark added to a particular color to get the output. The HSV model values for saturation fall between 0 and 1. Values closer to 1 tend to be black and those closer to 0 are white. For practical image analysis purposes we will gate out values close to zero and one. Last, the value parameter contains information about how much of a particular color a specified pixel retains. Similar to saturation, the value parameter is scaled to numbers between 0 and 1. Values closer to 1 are brighter and represent so-called “pure colors”. For more information about the HSV color model and digital chromatics, click here.
Image Analysis
Visualizing an Image
For our first exercise, we’ll open an image in FlowJo and reconstruct it in the Graph Window to look similar to our actual image. The purpose of this exercise will be to create a reference point for further analysis. This section assumes the user is familiar with opening a workspace, dragging and dropping, gating and basic rescaling functionality. If you need help with any of these, please click on the link within the word or topic.
1. Begin by dragging an image from the Finder/ Explorer window or from your desktop.
2. Drag the newly synthesized FCS file (same name as the original file, but with FCS extension) into the workspace.
3. Double-click the FCS file to open the Graph Window.
4. Rescale the X and Y location parameters (Parameters 1 and 2) such that the image falls nicely within the graph window.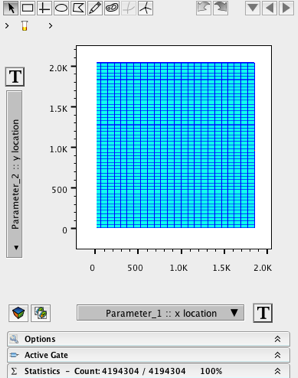
5. Change the parameter on the X- axis to Saturation (parameter 7).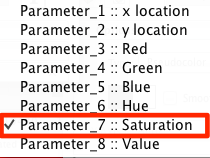
6. Change the parameter on the Y- axis to Histogram.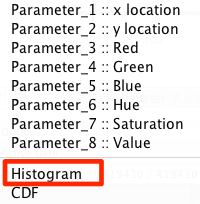
7. Rescale  the Saturation parameter if necessary.
8. Create a ranged gate on the Saturation parameter that excludes values close to the left or right axes. This will eliminate pixels that are either all black or all white.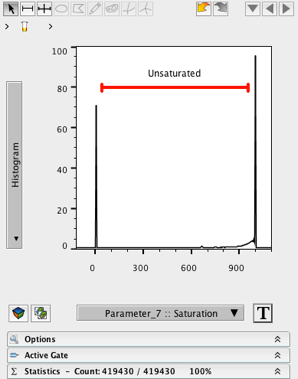
9. Name this gate Unsaturated.
10. Double- click on the gate to view the child population.
11. Change the X and Y axes to parameters 1 and 2 respectively.
12. You should see an “image” in the graph window roughly similar to the actual picture. Note: FlowJo rotates the axes by 90° counter-clockwise. For a direct comparison instruct your photo editing program to rotate the image 90° to the left.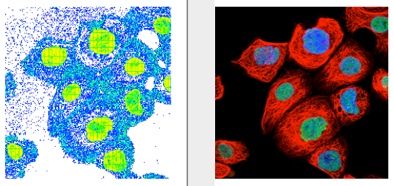
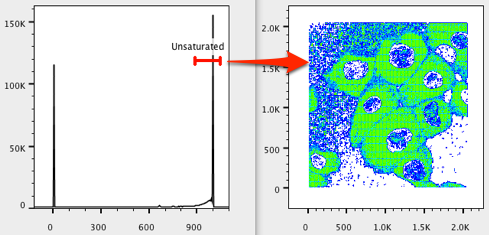
13. Move the Unsaturated gate to the right and resize it to include only saturated events. Note how the plot includes areas where most of the pixels have an abundance of colors (in our case, the cytoplasm and nuclei).
 14. Move the Unsaturated gate to the left and resize it to include the least saturated events. Note what appears to be a photographic “negative”. The events closer to zero on the saturated axis represent areas where pixels containing the least amount of color are present. In our case, these are the areas devoid of cells.
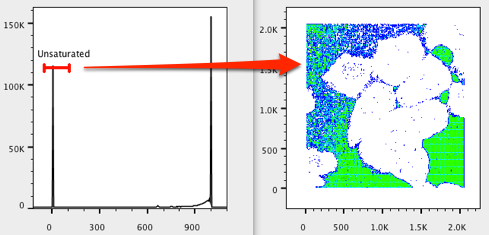
Image Reconstruction RGB
A common practice in fluorescence/ multi-channel microscopy is visualizing an image as produced by a single channel. By looking at the individual channels, we can determine whether a particular biomolecule exists, assess its intensity, geometry, and location within the cell.
In the next exercise we will reconstruct our image channel by channel and create an overlay (merged plot) using the Layout Editor.
- Drag the image file into the workspace.
- Drag the image associated FCS file into the workspace.
- Double click the FCS file to open the image in a graph window.
- Resize the X and Y location paramters (1 and 2) to fit the image within the graph window. See section above for details.
- Change the X- axis to Parameter 3 (Red).
- Change the Y- axis to Histogram
- Create a wide ranged gate on the histogram, excluding events near 0.
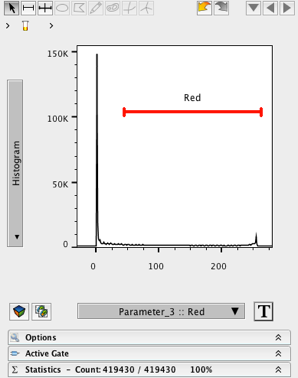
8. Name the gate (e.g. Red)
9. Double-click the gate to open a graph window of the child population.
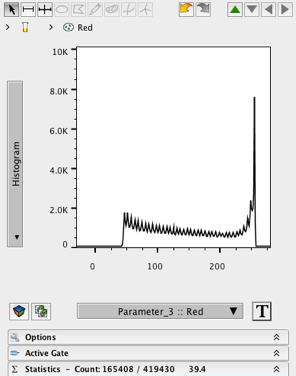
10. Change the X- axis to Parameter 1.
11. Change the Y- axis to Parameter 2.
12. You should see a plot that renders a pattern similar to the image file when shown in the red channel only.
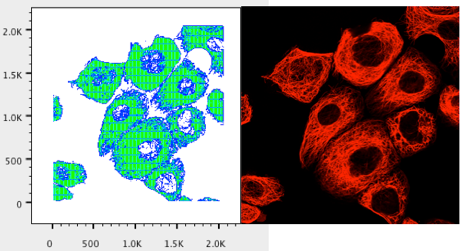 13. Duplicate the graph window using the duplicate graph window icon in the bottom left.
14. In the duplicated graph window, click the green “up” arrow to return to the parental population.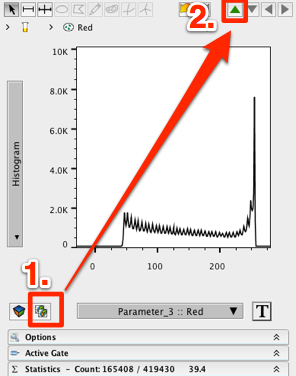
15. Change the X- axis to Green.
16. Change the Y- axis to histogram.
17. Create a wide ranged gate on the histogram, excluding events near 0.
18. Name the gate (e.g. Green).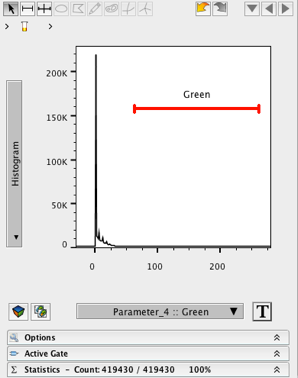
19. Repeat steps 9-12 to visualize a plot representative of the green channel in your image.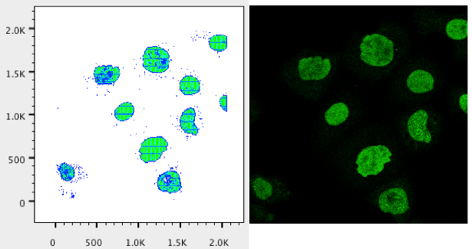
20. Repeat steps 13-18 for the blue channel.
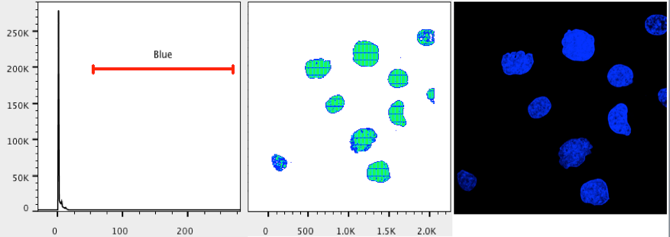 21. Open the Layout Editor
22. Select the Red population in the workspace.
23. Drag the Red population into the Layout editor . A histogram plot of the red population should appear.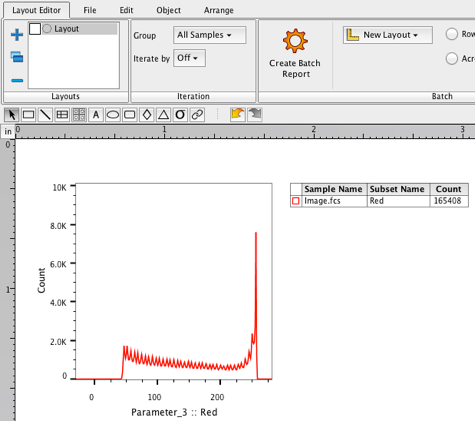
24. Control/command-click to select the Green and Blue populations in the workspace.
25. Drag the Green and Blue populations onto the Red plot in the Layout editor.
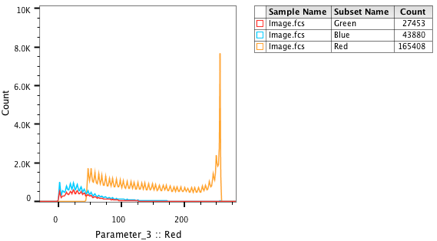 26. An overlay will be created representing all three channels.
27. Double click on the graph to open the graph definition window.
28. On the specify tab, change the graph type to dot plot.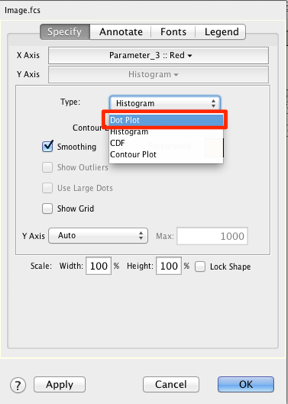
29. Change the X and Y axes to Parameter 1 and 2, respectively.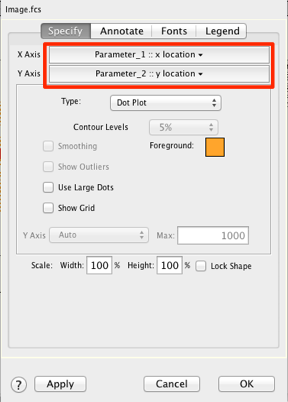
30. Click Apply, then Ok on the bottom of the graph definition window to apply your changes.
31. Change the color of the dot plot by selecting the legend and scrolling over the color palette.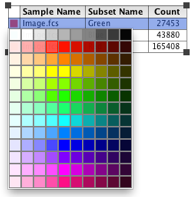 32. Change the colors of the dot plot to the appropriate channel color to reconstruct the image in FlowJo.
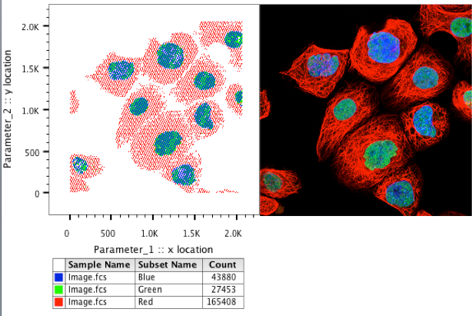
Pixel Analysis RGB
Fluorescence microscopy is a widely used technique that generally employs the use of 3 UV sources. These sources give rise to the ever popular red (R), green (G), and blue (B) merged images we see throughout the scientific literature. Though systems are not limited to these three channels (colors), these parameters are still the most widely used. The following section will focus on images that use these three channels for analysis. If your images have channels in addition to RGB, you may wish to consult the following section on HSV image analysis.
It is often useful to measure the pixel intensity of a particular channel as a means of comparison. For instance, you many have images taken from a control sample and want to compare it to an experimental set of images to discern qualitative/ semi-quantitative level of expression, absence or presence of molecules, or geometries of certain biological entities.
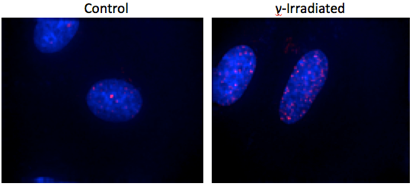
In the following exercise we will quantify the expression of phospho- γ-H2AX in nuclei of control and irradiated rat embryo fibroblasts. γ-H2AX is a histone protein that is phosphorylated and recruited to sites of DNA double strand breaks. γ- irradiation causes DNA double strand breaks and hence and increase in the presence of phospho- γ-H2AX in nuclei.
This exercise assumes the user knows how to open workspaces, add samples, rescale axes, create gates and statistics, and general use of the Layout and Table editors.
- Open a new workspace.
- Drag and drop the image files you wish to analyze from the Finder/ Explorer window into the workspace.
- Start your analysis with the control image first.
- Resize the image by adjusting Parameters 1 and 2 (x and y location).
- Change the X- axis to Parameter 3 (or to the channel expressing the molecule of interest).
- Change the Y- axis to histogram.
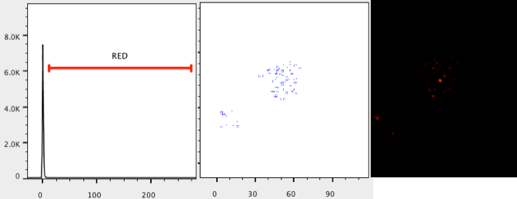
- Create a ranged gate, excluding values near zero.
- Name the ranged gate (e.g. Red)
- Check that the ranged gate is including pixels that are present in the image by viewing the child population and changing the axes to the location parameters (Parameters 1 and 2). Adjust the ranged gate if necessary.
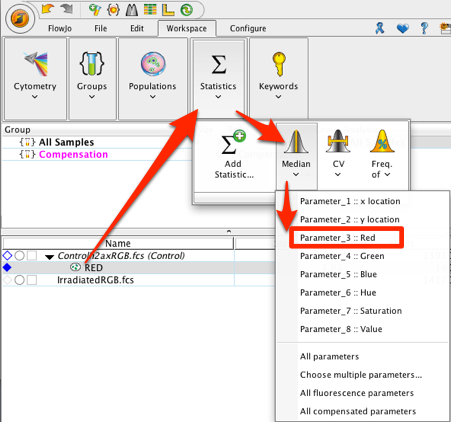
10. Add a median statistic for the red population in the workspace.
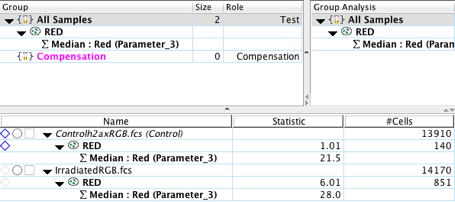
11. Copy the analysis to the group (the Red gate and median statistic).
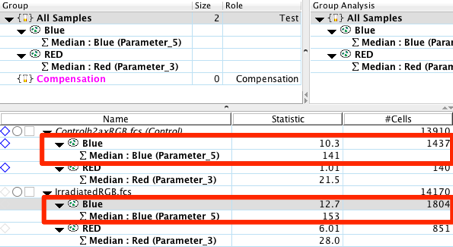
12. (Optional) As an internal control, use another channel where expression of antigen is not expected to increase/decrease significantly due to treatment, and add statistics and gates as in steps 5-11 (e.g. the Blue channel used for Hoescht stain).
13. You can export these statistics and produce graphical reports using the Table and Layout Editors . For more information on creating tables and graphical reports click on the links for the Table or Layout Editors within this sentence.
From the statistics calculated in the workspace, we can immediately witness significant differences between the control and experimental samples. The irradiated sample has a 30% increase in the MFI for the phospho- γ-H2AX protein. In addition, the number of events, in our case pixels, that fall within our Red gate is over 4 fold the amount seen in the control. It is important to remember to compare multiple images against one another in order to achieve statistical significance and lower the variability introduced by other factors (e.g. cell size, cell number, position on the slide, etc.).
Meta Analysis of Image Files
Coming soon, you will be able to gate multiple images at one time and group them based on fluorescence intensity, saturation, number of pixels, etc.
