This page provides details on the Plate Editor tool.
The Plate Editor has a ribbon with four tabs containing bands of available actions.
The Plate Editor tab contains tools to create new, duplicate or delete plates, gather data from the Workspace and annotate:
Annotate Experiment allows you to provide a description of your experiment following the MIFlowCyt standard.
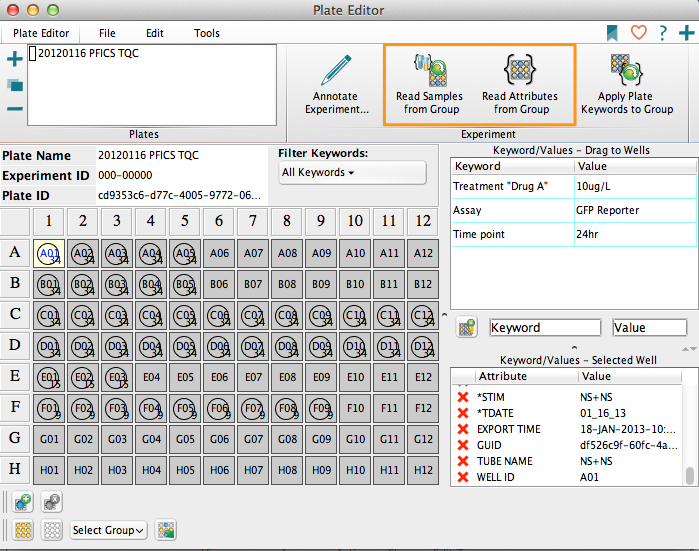
Read Samples from Group will pull data in from the Workspace using whichever group is currently selected. If you acquired your data in a plate, the WELL ID keyword identifies position of each sample and they will load into the plate. Click this to match samples in the current group to the wells in the current plate.
Read Attributes from Group will allow you to view and modify the keywords in sample files loaded into the plate. When you click this the Plate Name, Experiment ID, and Plate ID fields populate. Each well is now annotated with keywords from the associated FCS file. The number of keywords associated with each individual sample is listed in the lower righthand corner of each well. Selected wells highlight with a tan color.

If just one well is selected, the Keyword/Values — Selected Well box in the right panel will populate with the keywords associated with the selected well. If you would like to strip one or more of the keywords off of that well click the red “X” to the left of the keyword.
If you hold down the shift key and click another well, all wells between will be selected; you can also hold down the ctrl/cmd key to selectively choose multiple wells. Row and column headers (letter, number) select an entire row or column.
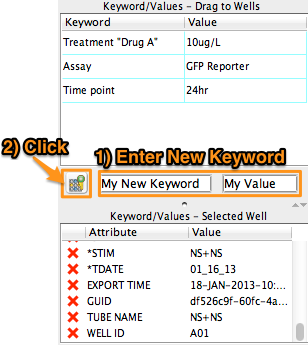
To add new keywords to a plate, type the keyword label and value into the Input Dialogue box. When you have completed typing the values click the ‘Add’ button directly to the left. The keyword pair will then appear in the Keyword/Values — Drag to Wells box.

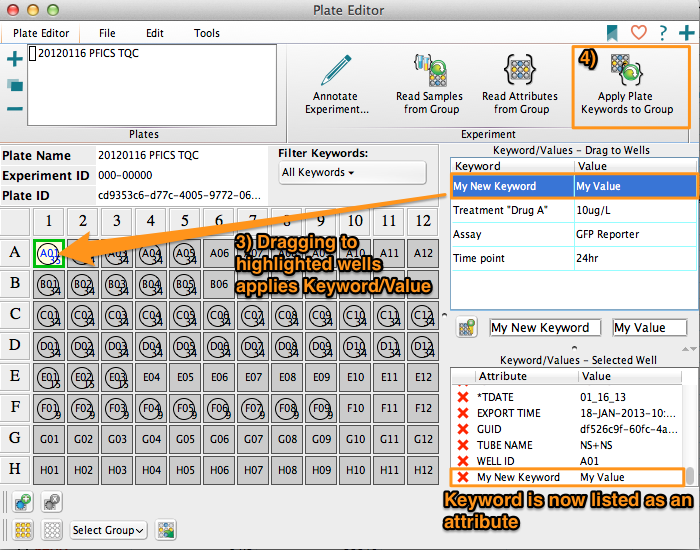
To apply this keyword to one or more files, drag it and drop it onto highlighted wells, a row, column, or all wells (by dragging and dropping to the blank the intersection of the row and column identifiers, in the top left corner of the plate).
When a keyword has been applied to a well or group of wells, those wells will be outlined with a green border. Click on different keywords listed in the Keyword/Values — Drag to Wells box to see which wells that keyword has been applied to.

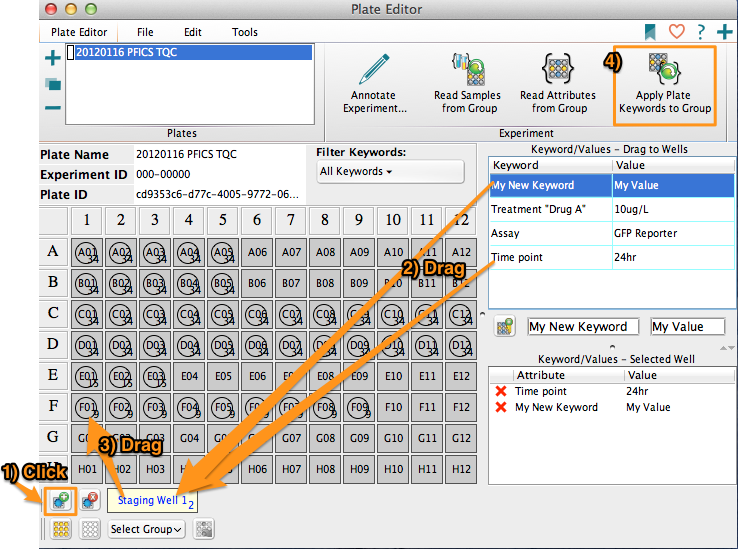
You can also drag keywords to a staging well, which allow sets of keywords to be assembled and then applied to one or more wells. The keyword counter in each staging well box increases as you add keywords.

Once you have completed annotating the wells, click Apply Plate Keywords to Group , and the keywords you have added to wells will be applied to those specimens, and are available as keywords to be displayed, used for iteration, or used for sorting throughout any other part of FlowJo.
The File tab contains the Document band with tools for exporting and importing metadata to and from external sources. Of particular interest is importing data from a spreadsheet, covered in Importing Metadata From a CSV file. Another useful tool is Save As Template. This will create a Workspace template (WSPT) file. Templates with plate definitions will attempt to associate keywords and (indirectly) groups to new samples based on matching PLATE ID and WELL ID keywords.

The Edit tab, contains the Clipboard and Select bands (by default), which allow for expediting your analysis process — tools include Copy, Paste, Select All, Invert Selection, Fill tools, and more. A useful tool in the Select band is Make Group, which will create a new group in the workspace from any selection of wells.

The Tools tab, can be used to format the appearance of the plates. The Settings band contains options for displaying the attributes, creating a heat map of numerical keywords, and coloring or scaling well borders. The Configure band includes a tool for setting up a dilution series. You can also add keywords from a file via the Keywords band.

Finally, the Layout Editor supports a plate object, which is a variation of a statistics grid for visualizing statistics in a full plate view.
See Also:
- Setting up a dilution factor keyword set
- Visualizing Plate-based Data
- Importing metadata from a CSV file
- Plates Band
- Plate Editor Overview
- Keywords and Annotation
