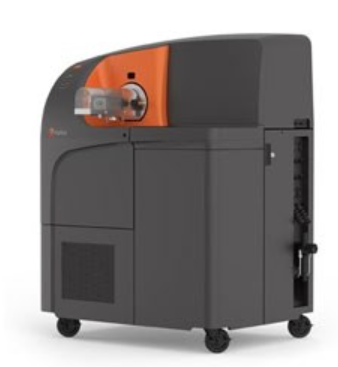
The CyTOF is a Time of Flight based mass spectrometer that produces FCS files as an output. The data can thus be analyzed in FlowJo.
What is a CyTOF?
The CyTOF is a mass cytometer produced by DVS Sciences. The name is an abbreviation for ‘cytometry Time Of Flight’, and the machine is used to conduct cytometry experiments on a much larger scale than can be achieved with a traditional fluorescence based cytometer.
In a mass cytometry experiment instead of tagging antibodies with fluorescent molecules, the tags are isotopes of any element that is not found naturally in the biological system under study. Cells labeled with these antibody-isotope conjugates are then vaporized, ionizing the elements. This is done within a magnetic field so that the particles move across the magnetic field to a detector at a rate proportional to the size of the particle; the lighter the particle, the faster it moves. The TOF part of CyTOF refers to the time it takes for these particles to fly to the detector. What makes this process so useful is that there is very little noise associated with the ion tags. Each element can be resolved so no compensation is necessary and any element that won’t occur in the sample is theoretically in play to be used as a reagent. DVS advertises that there are over 100 detector channels. For more detailed information on how the CyTOF works and an example application, see this 2011 Science paper from the Nolan lab on characterizing differential immune and drug responses.
How to use CyTOF generated data in FlowJo
1. Scaling and Display Preferences
1.1 Cytometer Based Preferences
1.2 Useful Display Preferences
2. Scale and transform modification
2.1 Arc Sinh Transform
2.2 T-button
3. Tools in FlowJo for High-Dimensional Analysis
_____________________________________________________________________________________
1. Scaling and Display Preferences
FlowJo X inherently works with CyTOF data. There is nothing special that a CyTOF user must do to get data on scale and all of the defaults scales are easily adjustable. Additionally we have included tools for high-dimensional data analysis.
1.1 Cytometer Based Preferences
Preferences are the default settings for how FlowJo functions. There is a preference for most actions in FlowJo that can be controlled through the preference menu. That menu is opened by clicking on the heart in the top right hand corner of the workspace window, as shown in Figure 1. The heart opens to display a graphic tab for each part of FlowJo. One of the items that can be set is how FlowJo displays data from each type of cytometer. Click on the Cytometers button, as shown in Figure 2, to view these settings.
FlowJo adds a cytometer to the preference list the first time you add an FCS file with a unique $CYT keyword. Figure 3 shows the Cytometers preference list for a FlowJo user who has used data from many different cytometers. In the figure the CYTOF has been click on from the list on the left. The $CYT display shows that these settings will apply to all FCS files that have the value ‘DVSSCIENCES-CYTOF-6.0.389’ for the $CYT keyword. The default values are displayed below.
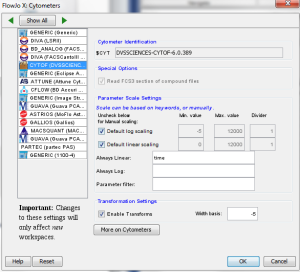
Figure 3
To change the default ranges for parameters displayed on either a log or linear scale, uncheck the box in front of the default scales. The numbers will un-gray, and the user may type any value they choose in. To set a particular parameter to be ‘Always log’, or ‘Always linear’, simply type the name of the parameter into the appropriate box. This is only necessary for parameters that are typically stored in the incorrect format on the cytometer.
The ‘Transformation Settings’ box allows the user to decide whether a transform should be applied to the data by default or not. If the ‘Enable’ box is check for CyTOF data, an arc sinh transformation (discussed more in section 2.1) will be applied by default. The width basis sets the size of the linear region of this transform, with the entered number negative by necessity, and the magnitude of the number indicating what range of the data on both sides of zero will be scaled linearly.
1.2 Useful Display Preferences
Another set of preferences that may be of use to CyTOF users are the graph display preferences. From the Preference menu, these can be accessed by clicking on the Graphs icon, as shown in Figure 4.
Figure 5 shows some of the items that may be of interest. Clicking on the graph type menu indicated by A. allows the user to choose a particular type of graph to use as default. Some CyTOF users prefer to work with contour plots, for example. Another alternative is to smooth a pseudo-color plot, which can be achieved by clicking on the ‘Smooth’ box (B.) just below this menu. C. notates the checkbox that will allow outliers to be displayed if a graph that doesn’t plot individual events, such as a contour plot or smoothed pseudo-color, is selected. D. notates the checkbox that allows the user to choose whether to display the parameter name. The checkbox notated by E. allows the user to turn off the warning of ‘Too many events on the axis’ for users who prefer to use untransformed plots.
2. Scale and transform modification
Not all data will look best with the default settings. A user may want to change one parameter individually, or one sample individually. To change either the transform used, or the scale of the data in such a case the T button on any axis in a FlowJo graph window can be used.
2.1 Arc Sinh Transform
The default transform that FlowJo uses for CyTOF data is the arc sinh. Unless the preferences are change by unchecking the ‘enable transform’ button, all CyTOF data receives this transformation for display. A plot of the arc sinh function for a range of data is shown in Figure 6. The important aspects of this function are:
- It is linear in nature around zero, and allows for low end data to be visualized.
- Beyond a control point, the function becomes logarithmic in nature, allowing for increasing compression of ‘positive’ populations.
- The control point can be set in FlowJo using the Width Basis
- It is a mathematically defined function, and so it can be represented exactly as displayed in FlowJo in any other software, such as R. The bi-exponential transform, the default in FlowJo for most other cytometers data, is created using a lookup table, so the exact final equation to represent the transform is an approximation.
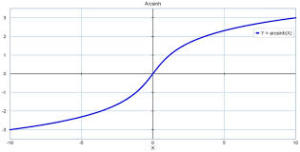
Figure 6
2.2 The T-button
The T-button is on every axis in FlowJo. It can be used to change transforms, change ranges, or zoom in or out on data. In Figure 7 the T-button has been clicked to enable the user to switch from an arc sin transformation to log, linear, or to customize the axis settings.
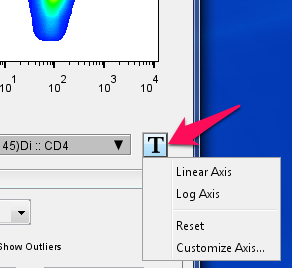
Figure 7
Figure 8 displays the window that appears if you choose to ‘Customize Axis’. The list on the right shows which parameters will be affected by the change. The user can highlight multiple parameters if desired. The graphic is displaying the parameter from the axis that the T-button was selected from. The + and – buttons on either edge of the axis expand or contract the displayed range. Below that (arrow 1) are a set of menus that allow you another place to change the transform type, or manually type in a range. Arrow 2 points at the box that allows for the width basis to be changed. This is not yet implemented for the arc sin function, but is for the bi-exponential, which produces a scale that looks similar to the arc sin. Arrow 3 points to a slider than can be moved to add ‘extra negative decades’.
Increasing width basis pushes more of the low end data into the linear region, which occupies a fixed portion of the physical display space. The effect is that the low end data appears more compressed. Increasing the ‘extra negative decades’ simply displays more space below zero. With CyTOF data this would just add extra white space to the plot.
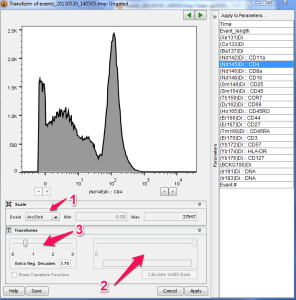
Figure 8
Figure 9 shows one CyTOF generated data file using different displays, transforms, and transform settings.
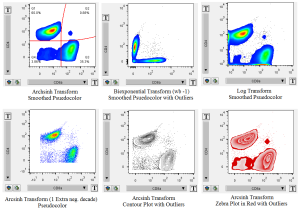
Figure 9
3. Tools in FlowJo for High-Dimensional Analysis
As well as displaying the data properly, FlowJo includes some analysis tools geared toward big data. For information on how any of the traditional FlowJo analysis tools work please see the FlowJo documentation or try the FlowJo tutorials at http://www.flowjo.com/home/tutorials/.
