Miltenyi cytometers use MACSQuantify software, which produces both MQD and FCS 3.1 files. The MACSQuantify rescales the data in the acquisition on a hlog display without changing the stored values. FlowJo displays the stored values.
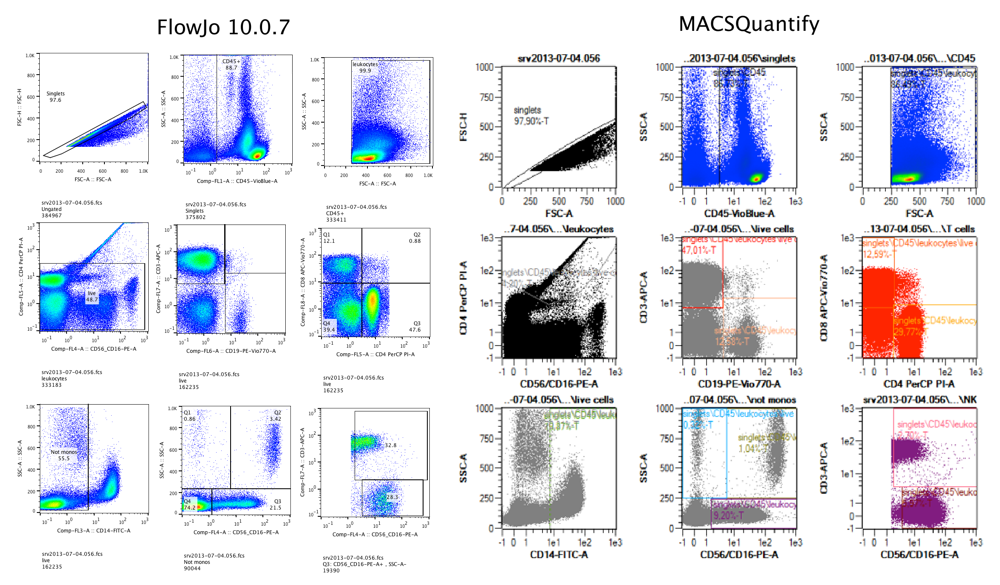
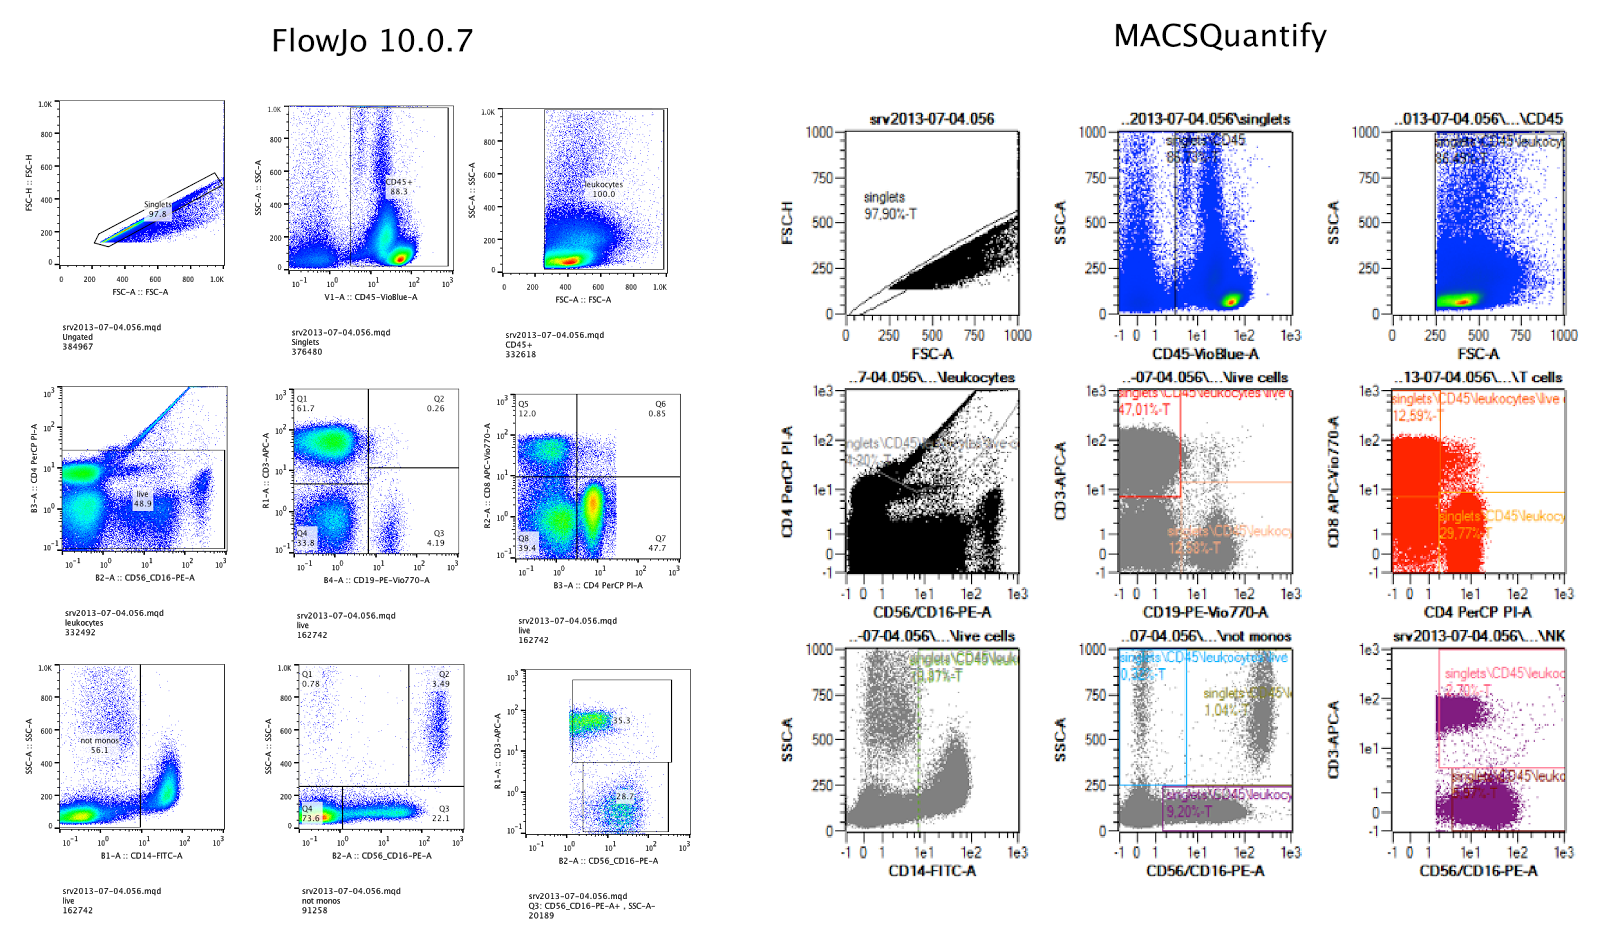
Preferences in FlowJo are set by default to rescale the data based on our understanding of the differences between their acquisition display and the written format of the file. FlowJo’s default preferences will display the data in a similar way to the acquisition software. As the MACSQuantify software rescales the data for display and FlowJo does not, the scales will be different, but the data will look the same (please see examples below). Because the scale of flow data is relative, this is acceptable. You can change these default preference sets in the cytometer specific preferences, and the transform settings can be adjusted manually and applied to parameters using the “T” button (please see this page for more information on data transformation)
Below is a side-by-side comparison of analysis of FCS3.1 Data in FlowJo 10.0.7 and MACSQuantify:


