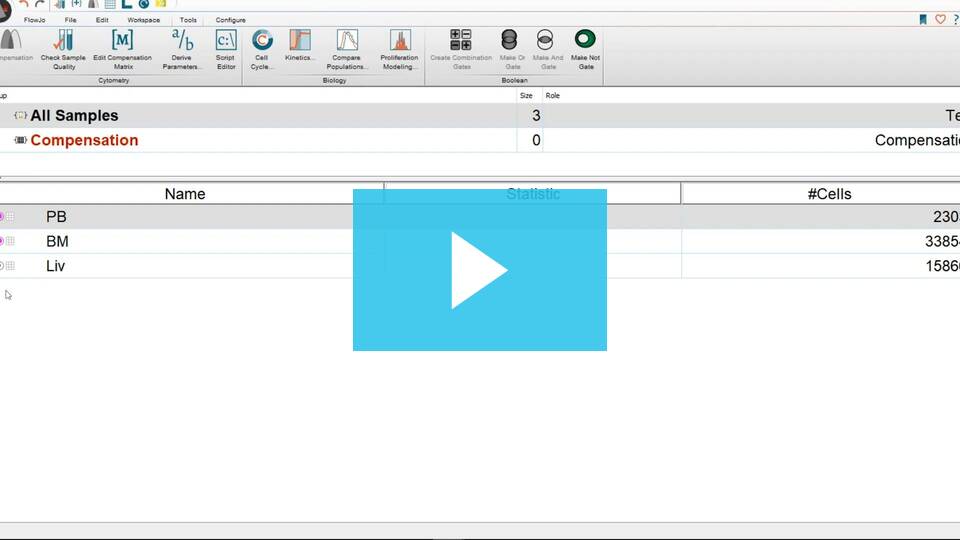
The Sample Quality Badge can be used to simply access the quality of each of the samples using the metric discussed in Sample Properties.
This check can be performed by simply double clicking on the circle to the left of the file name. The color of the dot will indicate the relative quality of the sample.
The sample quality check is intended as a quality control indicator of your acquisition. On occasion, you may encounter a clog while collecting events on a cytometer. Clogs can cause any parameter signal to spike, and will be recorded in the FCS file as a significant signal anomaly in any parameter. Other spike-inducing events include a sudden change of voltage for a chosen parameter, laser or photo-multiplier tube failure, and other electronic or mechanical problems.
Spikes or other anomalies affecting the quality of your data are extracted from the FCS files by FlowJo. FlowJo scans intensity vs Time looking for anomalies in each of the present parameters. Briefly, several bins are averaged together generating a histogram of the entire acquisition. The modal peak of the highest bin for each parameter is measured against a median (representing the central tendency of the entire samples’ events). The greater the distance the modal peak from the median, the more severe the signal spike is. FlowJo displays the severity of signal spike in the circle badge, using the warmer colors and a larger fill to indicate greater severity. You can also view the sample quality check graphically in the Inspect menu.
- A circle with a small blue dot or fill indicates a very smooth acquisition. No significant spikes (<1.0 SD from the median of any parameter).
- A circle with a small green dot indicates a smooth acquisition. No significant spikes (<1.5 SD from the median of any parameter).
- A circle with a purple dot with a large fill indicates an irregular acquisition. A moderate spike in some parameter (<2.0 SD from the median of any parameter).
- A circle with a red dot with a large fill indicates a problematic acquisition. Significant spike(s) in a parameter (>2.0 SD from the median of any parameter).
In the event a sample has a purple or red dot, you may opt to create a time or event# gate to remove the anomalous data from your analysis.
If sample quality is a major concern, the FlowAI, PeacoQC, or FlowCut algorithm could be used to clean the data. The video below describes using those algorithms.

